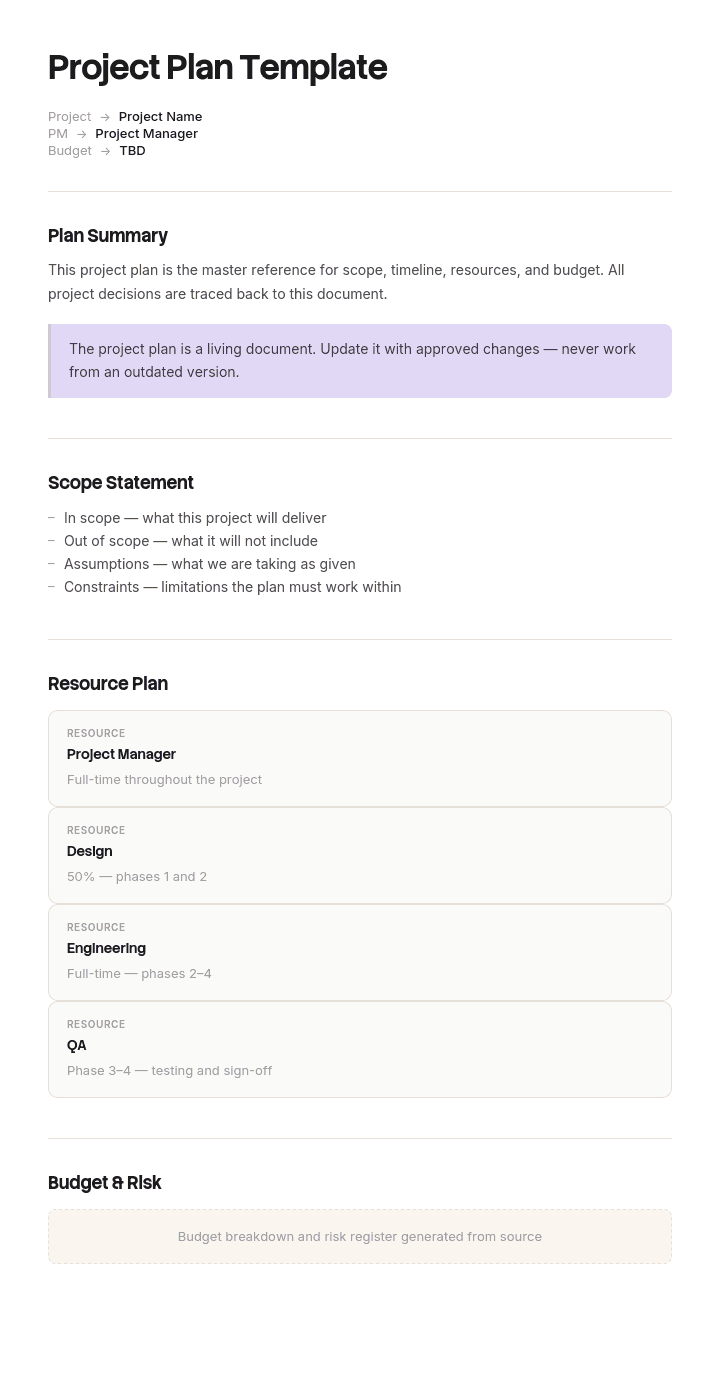
Use this template
A project plan is the master document that turns an idea into reality - it captures everything from scope and schedule to budget and risk. With Trupeer, you can save hours on planning by starting with a free project plan template, customizing it with your brand identity, and turning the plan into a video walkthrough that aligns stakeholders fast.
What is a project plan template, and what is it not?
A project plan sets out what will be delivered, in what sequence, by whom, by when, and what it depends on. It is written once at the start, agreed, and then used as the thing reality is compared against.
A tracker records where things currently are. It changes every week, it reflects the latest position, and its job is to show status rather than to record intent.
Search for a project plan template and most of what you will find is a tracker. That is not a criticism of the templates, it is a reflection of what people actually need: the majority of the related searches for this term name Excel, Google Sheets or a tracker explicitly.
The problem is that the two get combined into one spreadsheet, and the combination destroys the only thing a plan is for. Once you edit a date in place, the original commitment is gone, and the question "are we late" becomes unanswerable.
Most people searching for a plan need a tracker
It is worth being straightforward about this, because it determines what you should build.
If your question is what needs to happen, in what order, and what depends on what, you need a plan. It is written once, it is argued over, and it involves sequencing and dependencies. Our IT project plan template covers building one against the external constraints most templates ignore.
If your question is what is the status of each thing and what is late, you need a tracker. It is maintained weekly and it should be much shorter than the plan.
Most teams need both, and most teams build one spreadsheet and call it the plan. That spreadsheet has task, owner, start date, end date and percentage complete, and it is edited continuously. It is a tracker with no memory.
The rest of this page is about keeping the two apart inside one file, which is the practical answer for almost everybody.
How to customize this template in Trupeer
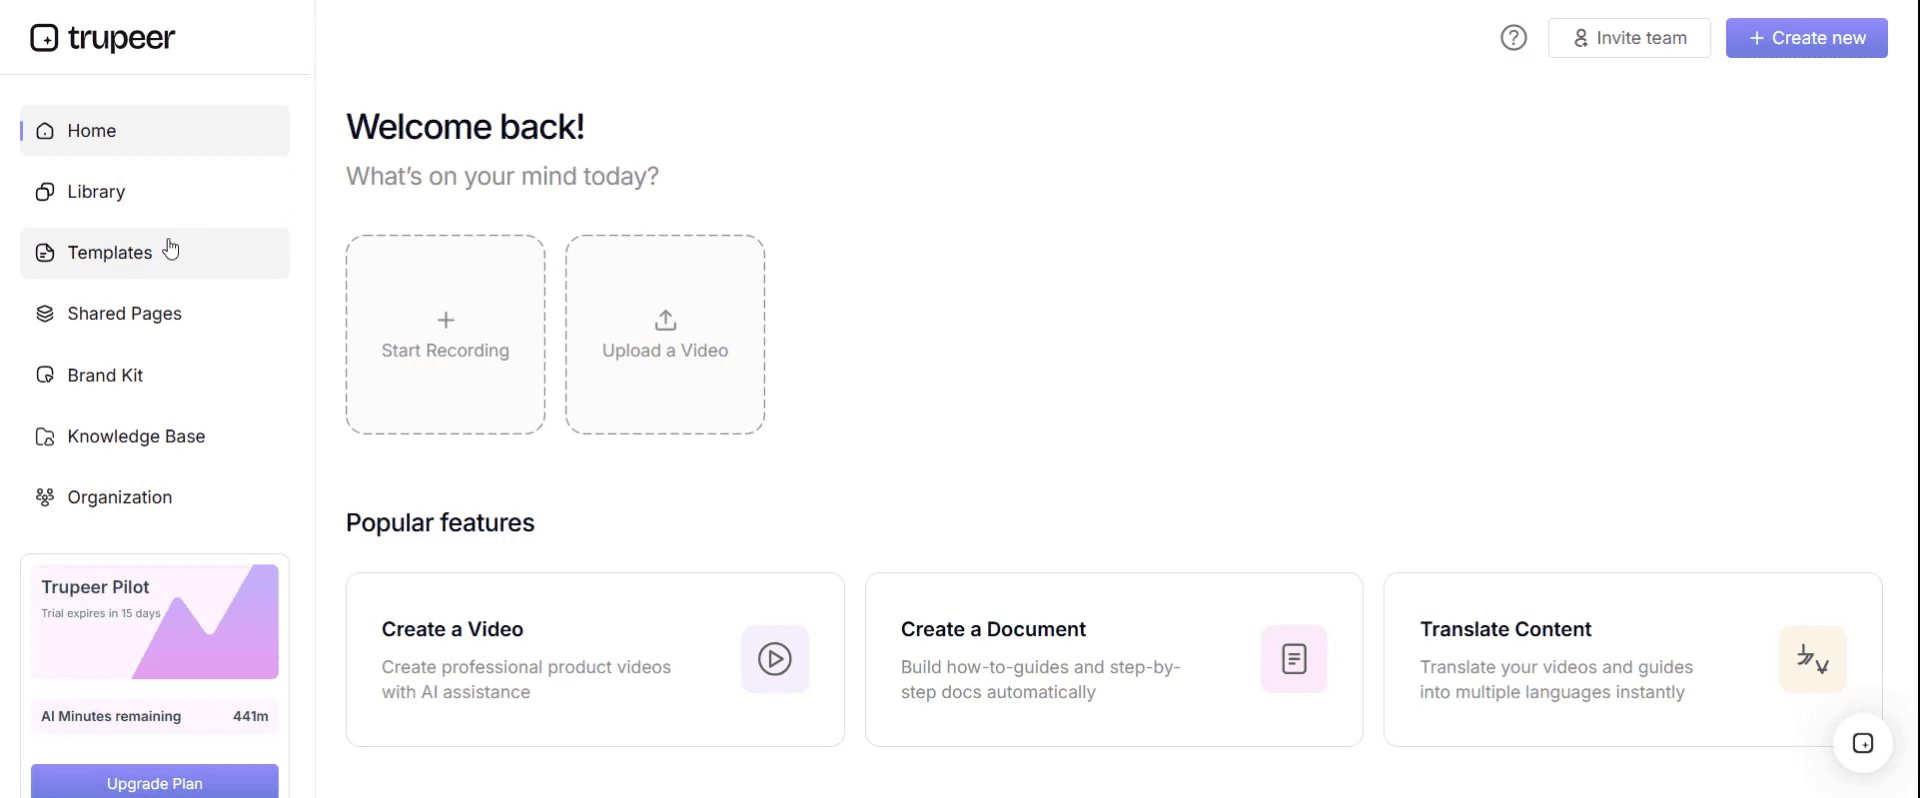
Step 1: Open the Templates Section
Go to the Templates section from the main navigation.
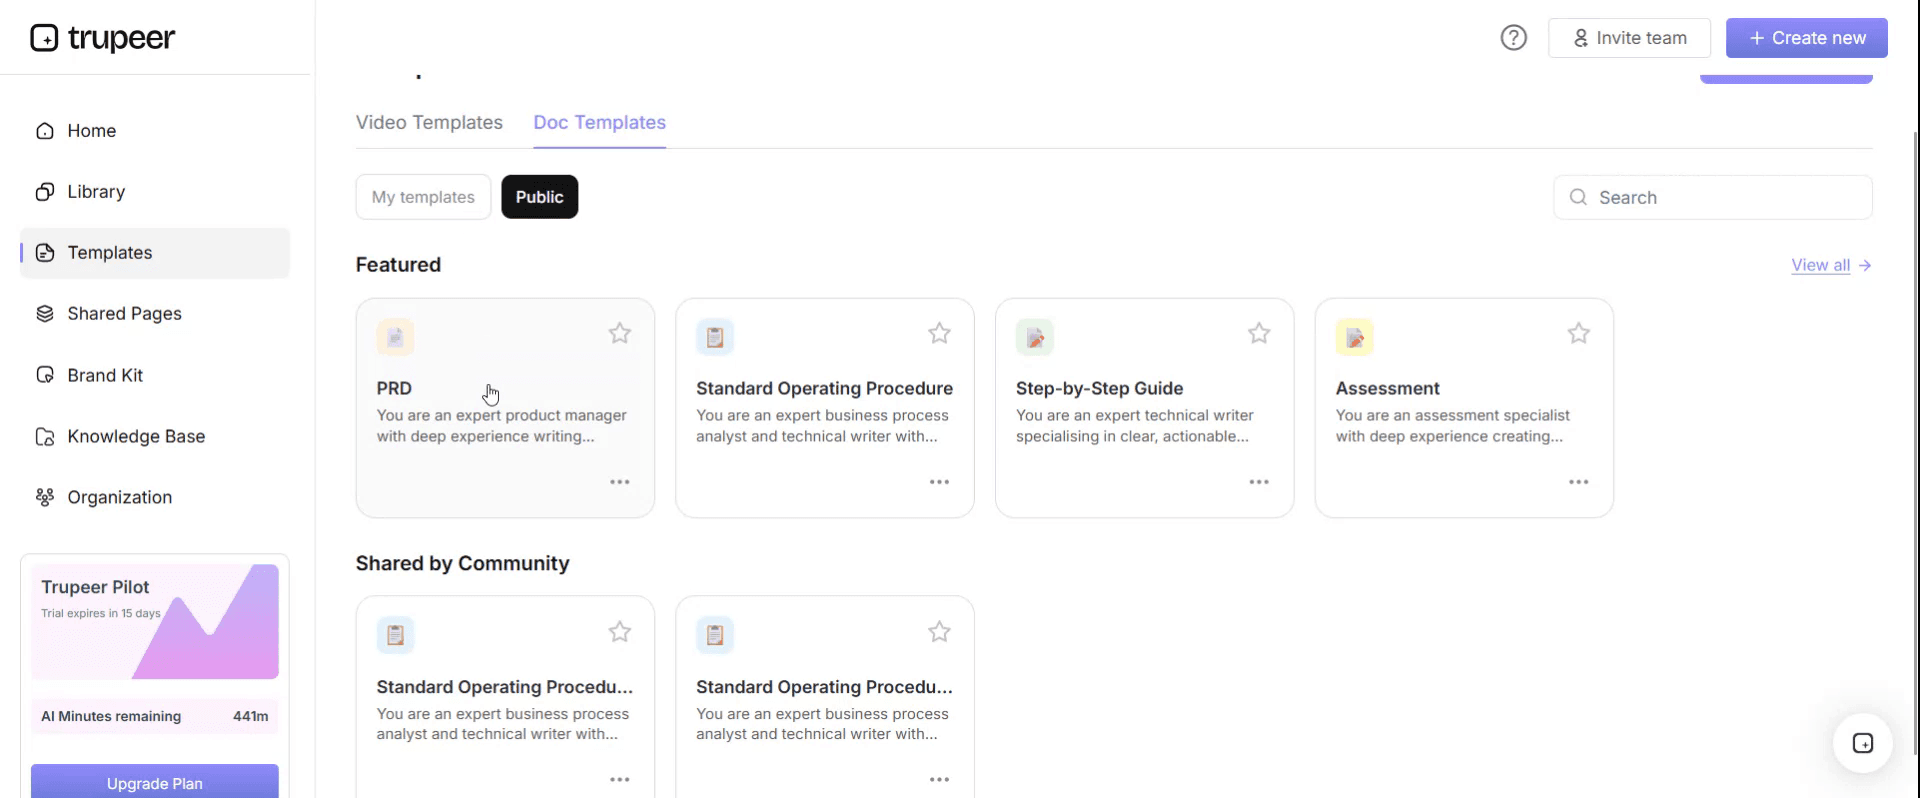
Step 2: Select and Open a Template
Click on any template you want to work with to open it.
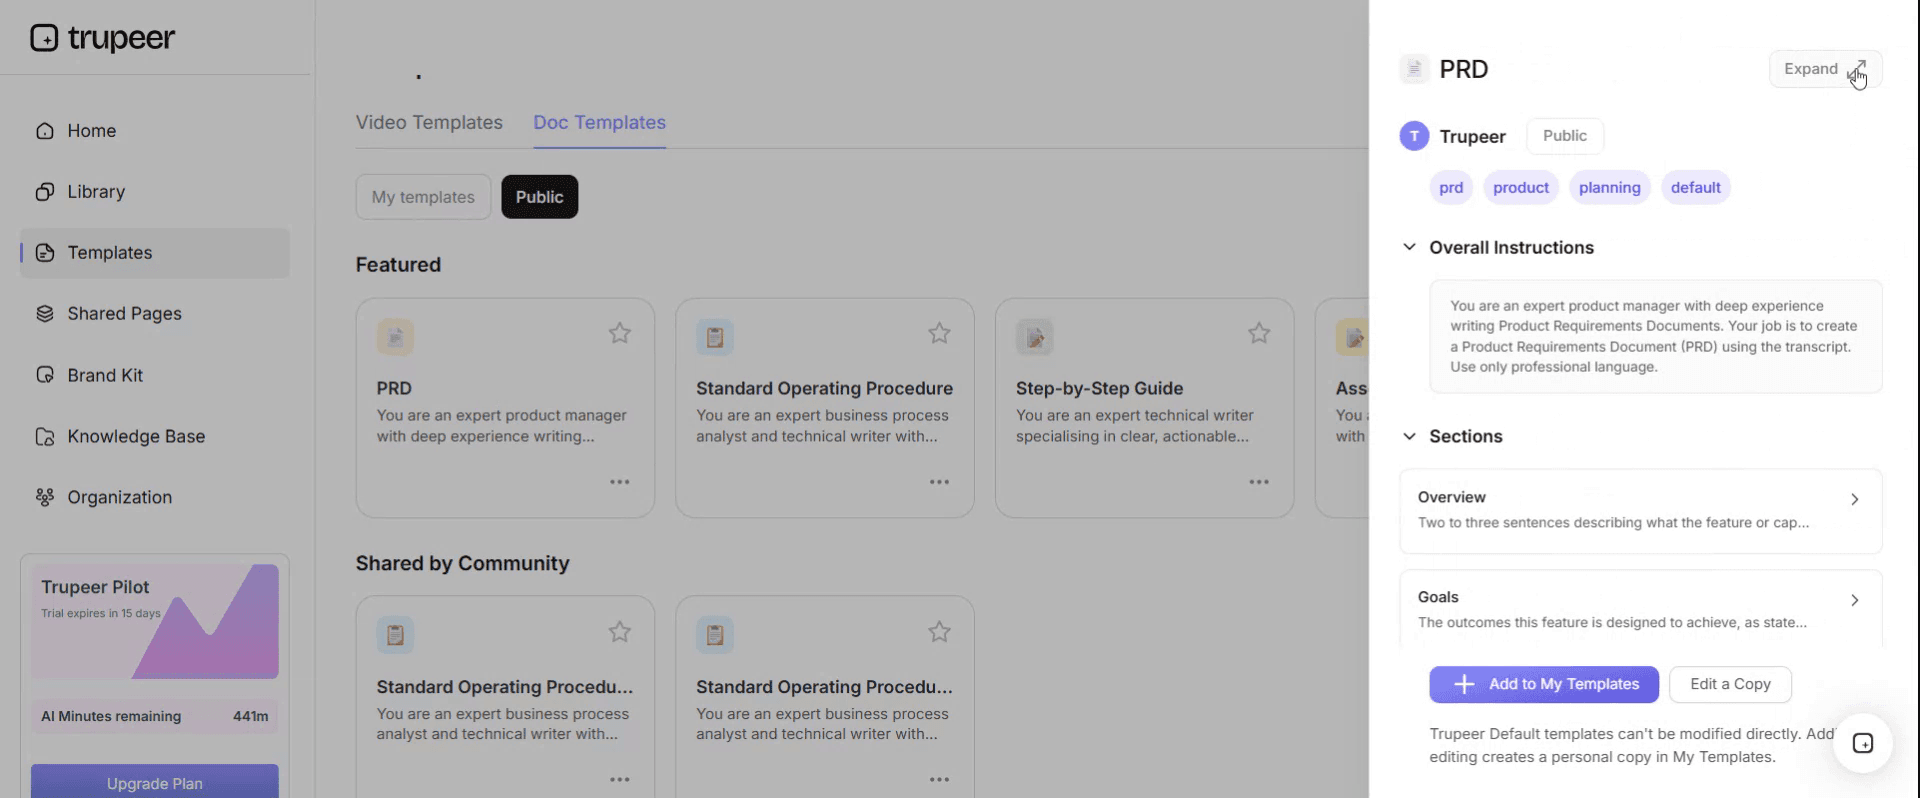
Step 3: Expand the Template View
If needed, expand the template view to see the full layout and details clearly.
Step 4: Edit the Template
Click on Edit to start modifying the selected template.
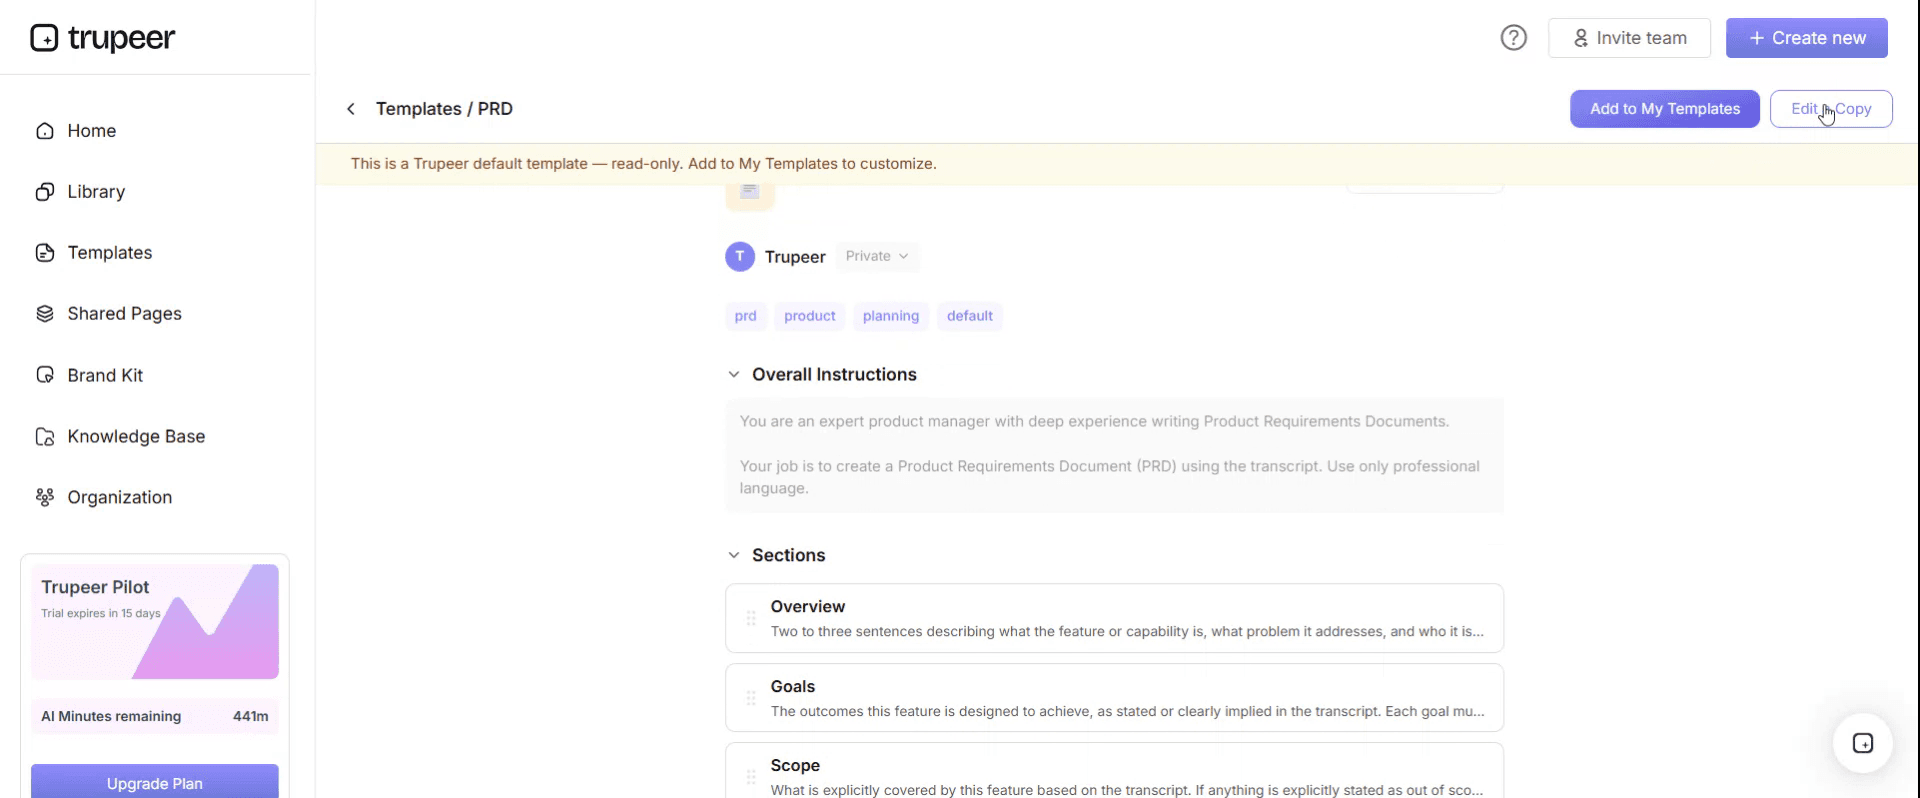
Within the editor, you can:
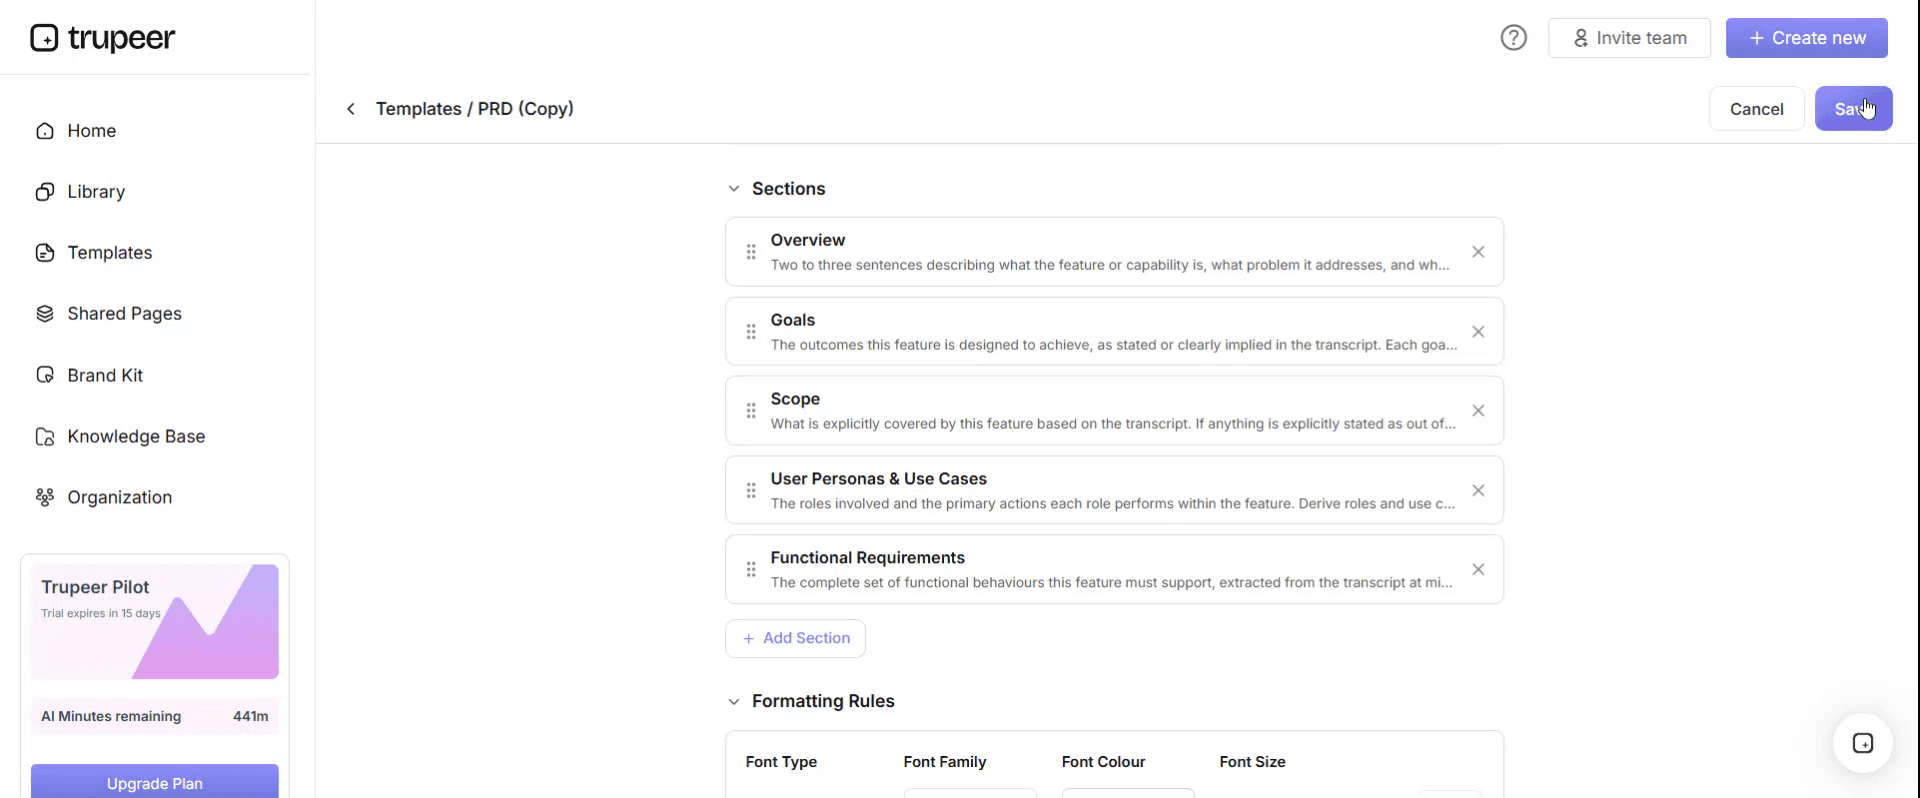
Add new sections
Define or update formatting rules
Add a logo and adjust its position and related settings
Step 5: Save Your Customized Template
After making all necessary changes, click Save to store the updated template as your own.
Step 6: Preview and Fine-Tune the Template
When you want to see how your customized template looks, open the Preview.
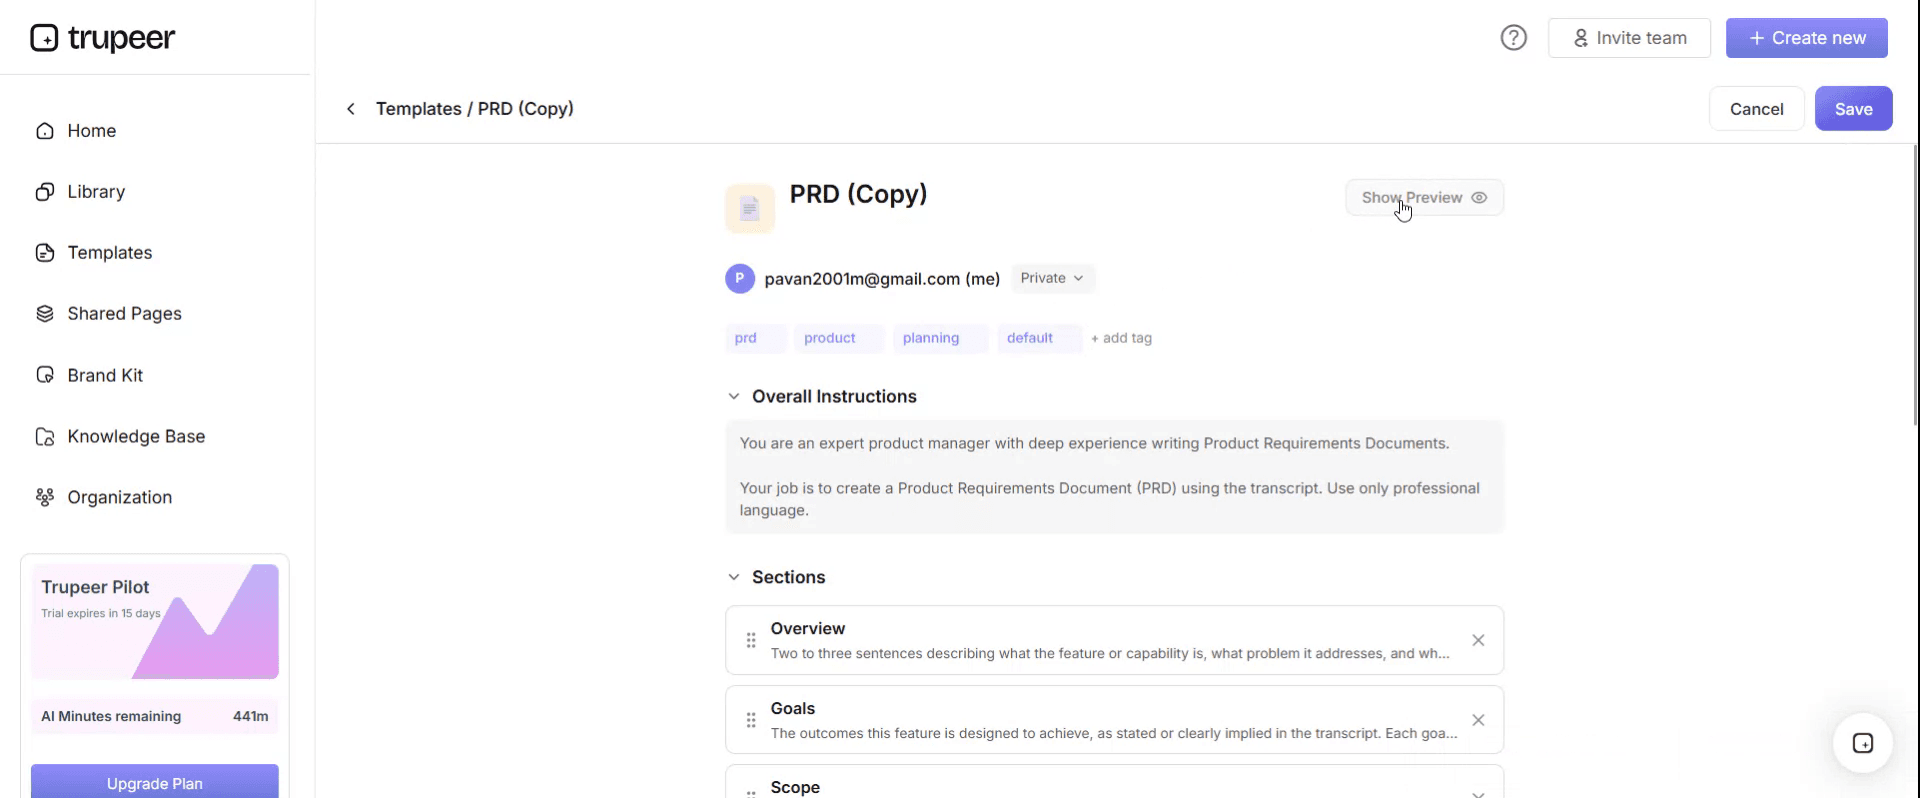
From the preview screen, you can continue to make adjustments directly if needed, ensuring the template appears exactly as you want.
With a project plan template you can:
Save hours on planning: Skip the blank page with a comprehensive project plan structure.
Cover every angle: Built-in sections for scope, schedule, budget, risk and communications.
Stay on-brand: Apply your logo, fonts and colors using Trupeer's brand kit.
Align stakeholders: Convert dense plans into video summaries everyone can watch in 5 minutes.
Standardize across projects: Use the same plan template for every initiative.
Reach global teams: Translate project plans into 65+ languages with one click.
A project plan without a baseline is a tracker
Here is the whole argument in one line: if the dates in your plan are the same cells you update each week, you do not have a plan.
A baseline is the set of dates as agreed, frozen. It is never edited. When a date moves, the forecast changes and the baseline does not.
That single discipline gives you three things you otherwise cannot have.
Whether you are late, and by how much. Not a feeling, a number, per task and in total.
Where the slippage originated. Most delay in a project traces to a small number of root causes, and everything downstream inherits it. Without a baseline, all you can see is that many tasks moved, not that forty of them moved because one decision took nine weeks.
Whether your estimating is any good. A baseline compared with actuals across several projects is the only feedback loop an organisation has on whether it plans realistically. Teams that edit in place never find out.
Re-baselining is legitimate, incidentally, but it should be a decision with a date and a reason rather than a side effect of updating a spreadsheet. Keep the original baseline too.
How to keep the baseline and the forecast apart
Two sets of date columns in the same row, and one rule.
Column | What it holds | Who edits it | When |
|---|---|---|---|
Baseline start | Agreed start date | Nobody, after sign-off | Set once at baseline |
Baseline end | Agreed end date | Nobody, after sign-off | Set once at baseline |
Forecast start | Current expected start | Task owner | Weekly |
Forecast end | Current expected end | Task owner | Weekly |
Actual start | When it actually began | Task owner | On starting |
Actual finish | When it actually finished | Task owner | On finishing |
Variance | Forecast end minus baseline end, in days | Calculated | Automatically |
Cause | Why it moved, in a few words | Task owner | When variance first appears |
The cause column is the one people leave out and the one that turns a variance report into something actionable. Without it you know forty tasks moved. With it you know that thirty of them moved because of the same upstream decision, which is a completely different conversation.
Protect the baseline columns so they cannot be edited accidentally. In a spreadsheet that means locking them; in project software it usually means an explicit baseline function that people do not know exists.
Why the tracker needs fewer rows than the plan
The second failure is volume, and it is what causes the tracker to be abandoned rather than to be wrong.
A plan reasonably contains every task. A tracker needs only the rows whose slippage matters, which means the critical path and every dependency on somebody outside the project.
Three hundred rows updated weekly by one person takes ninety minutes and stops happening by about month four. Forty rows takes twenty minutes and survives.
The tasks that come off the tracker are not unmanaged. They are managed by whoever owns that workstream, in their own list, and they surface in the tracker only if they threaten something on it.
The test for whether a row belongs on the tracker: if this slips by two weeks, does the project's end date move, or does somebody outside the project have to be told? If neither, it belongs in the plan and not in the weekly update.
Free project plan template: the columns to copy
Copy from here. One sheet for the plan and tracker combined, plus a second sheet for the narrative.
Sheet one, tasks. Task ID. Task name, verb first. Workstream. Owner, a named person. Predecessor task IDs. Baseline start. Baseline end. Forecast start. Forecast end. Actual start. Actual finish. Variance in days, calculated. Cause of variance. Status: not started, in progress, complete, blocked. On tracker: yes or no. Notes.
Sheet two, plan narrative. Objective and success criteria, referencing the project brief. Scope in and out. Assumptions, each one numbered so a variance cause can point at it. External dependencies, with the party and the date agreed with them. Resourcing. Key risks with triggers rather than scores. Baseline date and who approved it.
Sheet three, variance log. Populated from the cause column: one row per root cause, with how many tasks it affected and how many days it added. This is the sheet that gets read at a steering meeting.
Copy to here. The variance log is where the value concentrates, and it costs nothing because it is derived from data you are already capturing.
The ERP project that could not say if it was late
Netherfield Foods, a food manufacturer, implemented a new enterprise system. The plan was a spreadsheet with three hundred and forty rows: task, owner, start, end and percentage complete. It was updated weekly, in place.
Fourteen months in, the sponsor asked a reasonable question. Are we late, and by how much?
Nobody could answer it. The spreadsheet showed the current forecast, which had go-live about five months beyond where it had originally been, but the original dates had been overwritten around sixty times and no record of them existed in the file.
They reconstructed the baseline from a PDF of the plan that had been emailed in month one and was still in the sponsor's inbox. That took three days.
The reconstruction was more useful than anybody expected. The original plan had been eleven months and the forecast was now sixteen. Of the three hundred and forty tasks, sixty one had moved by more than four weeks. Forty four of those sixty one were downstream of just three delays: a data migration dependency, a third party integration, and a decision on the chart of accounts that took nine weeks.
Three root causes accounted for roughly seventy two percent of the movement, and none of that had been visible, because every date had been edited in place and the spreadsheet only ever showed the present.
There was a second problem with the same origin. Three hundred and forty rows meant the weekly update took about ninety minutes and was done by one person. By month nine it was being done fortnightly, and the percentage complete figure on around a hundred and ninety rows had not changed in three months.
The five month slip cost roughly four hundred and eighty thousand pounds in extended contractor and internal resource. The more avoidable cost was the chart of accounts decision, which sat unescalated for six weeks while blocking twenty two downstream tasks, because nothing in the tracker showed it as blocking anything.
The next phase changed two things. Baseline dates were frozen in their own columns and locked. Forecast dates sat alongside them with a calculated variance and a cause column. And the tracker was cut from three hundred and forty rows to forty seven: the critical path plus every external dependency. The remaining tasks stayed in the plan and were managed by workstream leads.
The weekly update went from ninety minutes to about twenty. The phase was planned at seven months and delivered in seven months and three weeks. Both delays that occurred were flagged within a week, because a two week variance on a critical path row surfaced automatically rather than being one changed cell among three hundred.
The key elements every project plan needs
Objective and success criteria. What the project is for, and how you will know it worked. Taken from the brief rather than invented here.
Scope, in and out. The out list is the one that prevents disputes.
Tasks with owners. Named individuals, not teams.
Sequence and dependencies. Which tasks depend on which, because that is what makes a date mean anything.
External dependencies. Anything relying on a party outside the project, with a date they have agreed to rather than one you have assumed.
Baseline dates. Agreed, frozen, and approved by somebody.
Assumptions, numbered. So that when something slips, the cause can point at the assumption that failed.
Resources. Who is available, for how much of their time, and what they are not doing instead.
Risks with triggers. An observable condition and an action, rather than a likelihood score.
The two most often missing are numbered assumptions and external dependency dates agreed with the other party. Both are cheap at planning time and both are what a variance analysis needs six months later.
How to plan a project from start to finish
Start from the brief, not from a task list. If you cannot state the problem and the success criteria, the plan will become a list of activity.
List the deliverables before the tasks. Tasks derived from deliverables are complete; tasks brainstormed directly tend to miss whole areas.
Sequence them and find the dependencies, particularly the ones on other teams and suppliers. Our procurement management plan template covers the procurement lead times that frequently sit on the critical path unnoticed.
Estimate with the people who will do the work, and record the estimate as a range where it is genuinely uncertain.
Now baseline it. Get somebody to approve it, record the date, and lock the columns.
Decide which rows go on the weekly tracker using the two week test above.
Then set the cadence: weekly forecast update by task owners, monthly variance review with the causes, and a re-baseline only as an explicit decision.
Project plan variants: Gantt, document and agile
Gantt chart plan. The same task data shown as bars against a timeline. Excellent for seeing dependencies and float, and it is a view rather than a different document. Build the table first and generate the chart from it.
Plan document. The narrative version: objectives, scope, approach, assumptions, risks and resourcing, with the schedule attached rather than embedded. This is what gets approved, and our project overview template covers the shorter version you show people outside the project.
Agile plan. Sprints or increments rather than a task-level schedule, with scope as the variable and dates fixed. A baseline still applies, but it is baselined against outcomes and release dates rather than against tasks.
Simple or one page plan. Milestones, owners and dates only. Genuinely adequate for small projects and considerably better than an unmaintained three hundred row spreadsheet.
Programme plan. Multiple projects with cross-dependencies. The baseline discipline matters more here, not less, because the interesting variance is always at the interfaces.
Project plan, brief or overview: which do you need?
Three documents that get confused because all three are shown to sponsors.
The brief states the problem and authorises the work. Written first, frozen, superseded by the plan. Our project brief template covers it.
The plan covers how the work will be delivered. Baselined and then tracked against, which is this page.
The overview summarises the current position for people outside the project, and it is rewritten monthly. Our project overview template covers it, including why a status colour tells a reader nothing.
Where you need gate conditions rather than a schedule, our project checklist template covers when each item is actually actionable, and for what should survive the project our project documentation template covers the set worth keeping.
Can I get a project plan template in Excel or Google Sheets?
Excel or Google Sheets, and for most projects that is the right answer rather than a compromise. The task sheet is a table with calculated columns and it wants formulas.
Three things to set up once. Lock the baseline columns so they cannot be edited. Add a variance formula and conditional formatting that flags anything past a threshold, two weeks being a reasonable default. And add a filter on the on-tracker column, so the weekly update view is forty rows rather than three hundred.
Google Sheets has an advantage worth noting: version history is automatic, which means even a team that edits in place can recover a baseline. That is a poor substitute for locking the columns and it has saved projects.
Word or Google Docs for the plan narrative, which is prose and gets approved.
PowerPoint for the plan you present, which should be milestones and dependencies rather than the task list.
PDF for the baselined version at sign-off, dated. Keeping that one file is what the reconstruction in the worked example above depended on.
When to stop using a spreadsheet and use software
A spreadsheet stops being the right tool at a fairly predictable point, and it is later than software vendors suggest.
Three conditions together are the signal: more than roughly a hundred tracked tasks, more than four or five people updating the same file, and dependencies that change often enough that recalculating the sequence by hand is error-prone.
Below that, a well set up sheet with locked baselines beats project software that nobody logs into.
Above it, the specific things software gives you are automatic dependency recalculation, a real baseline function, resource levelling across projects, and an audit trail. The specific thing it takes away is that people outside the project can no longer open it, which is why plenty of organisations end up maintaining both and should not.
If you do move, export a baselined copy to a spreadsheet at each re-baseline, because the ability to read the plan in five years should not depend on a licence.
How to keep the plan connected to what the team does
A plan describes tasks. Whether those tasks are being done the way the plan assumed is invisible in the schedule, and the gap usually shows up as a task that stays at eighty percent complete for a month.
The most common reason is that a task turned out to involve work nobody had described, and the person doing it is now inventing a process while also being tracked against a date.
Trupeer AI helps at that point. Whoever is doing the work records the process once and the output is a written guide with the steps and screens captured, which means the next occurrence is faster and the estimate for it is real. It also gives you something concrete to attach to a variance cause: this took three times as long because the step involved four systems rather than one.
Record it. Brand it. Translate it. Trupeer it.
Those recordings become the handover and training material later, so the effort is not spent on reporting alone. The material lives in your knowledge base in consistent branding, and where the project hands something over at the end our project handover template covers what the receiving team actually needs. Setup instructions are in the document template setup guide.
Frequently Asked Questions
Is there a free project plan template in Excel?
Excel is the right format for most projects and the column set above builds into one sheet. There is no gated download and no form. The two changes worth making to whatever template you already use are locking a set of baseline date columns and adding a cause column beside the variance.
Is there a free project plan template in Word?
Word suits the plan narrative: objectives, scope, assumptions, dependencies, risks and resourcing. Keep the schedule in a spreadsheet and reference it, because a task table in Word cannot calculate variance and becomes unmanageable past about thirty rows.
Is there a free project plan template in Google Sheets?
Yes, and Google Sheets has one genuine advantage over Excel here: automatic version history, which means a baseline can be recovered even if somebody edited in place. Use it as a safety net rather than as the mechanism, and lock the baseline columns anyway.
Is there a free project plan template in PowerPoint?
Use slides for the plan you present rather than the plan you run. Milestones, external dependencies and the critical path. Presenting a three hundred row task list is a reliable way to spend an hour discussing row forty seven.
Is there a free project plan template in PDF?
Export the baselined version at sign-off, dated, and keep that file. In the worked example above, an emailed PDF of the original plan was the only surviving record of the baseline and it took three days to reconstruct from it.
Where can I find a project tracker template in Excel?
The tracker is the same sheet filtered to the rows that matter: critical path plus external dependencies, which for most projects is forty to sixty rows rather than three hundred. Build the plan first and derive the tracker with a filter, rather than maintaining two files that disagree within a fortnight.
How many rows should a project tracker have?
Forty to sixty for a substantial project. The test for each row is whether a two week slip would move the project end date or require telling somebody outside the project. If neither, it belongs in the plan and not in the weekly update, which is what keeps the update to twenty minutes rather than ninety.
What is the difference between a project plan and a schedule?
The schedule is the dates and sequence. The plan is the schedule plus everything that makes it meaningful: objectives, scope, assumptions, dependencies, resources and risks. A schedule with no assumptions recorded cannot explain why it slipped, which is the difference the baseline and cause columns exist to close.