Use this template
A clear process flow turns a complex workflow into something anyone can understand at a glance. With Trupeer, you can save hours on mapping workflows by starting with a free process flow template, customizing it with your brand guidelines, and turning process flows into video walkthroughs that bring every step to life.
What is a process flow template, and what is it for?
A process flow, or flowchart, is a diagram showing the sequence of steps in a process, with decision points where the path splits and arrows showing where each path goes.
A process flow template is a pre-built version: the shapes, the layout conventions and often a worked example, so you are adjusting something rather than starting from an empty canvas.
They are genuinely useful for two jobs. Making a decision, where drawing the current state lets a group see the handoffs, the loops and the approvals nobody had counted. And showing branching, where the reader's next action depends on what they find, and text cannot express that without becoming unreadable.
For everything else, and it is most things, a flowchart is a numbered list that somebody has made harder to update. That claim is the substance of this page, and it is the opposite of what a search results page full of template galleries will tell you.
When a flowchart is worth drawing at all
Three situations justify it.
You are trying to see something. Drawing the current state of a process, with everybody who touches it in the room, reliably surfaces things nobody knew: the approval that happens twice, the handoff that crosses departments four times, the loop that sends a third of cases back to the start. This is the highest value use of a flowchart and it has nothing to do with the diagram being kept afterwards.
The reader has to choose. Troubleshooting, triage, eligibility checks, escalation routing. Where the next action genuinely depends on what the person finds, a diagram or a decision table beats a numbered list, because a numbered list implies a sequence that does not exist.
The process crosses several roles and the handoffs are the point. This is what swimlanes are for, and it is a narrower case than the popularity of swimlane templates suggests.
If none of the three applies, you are drawing a picture of a list. The list will be quicker to write, easier to read on a phone, searchable, and updatable by anybody. Our process documentation template covers that shape.
How to customize this template in Trupeer
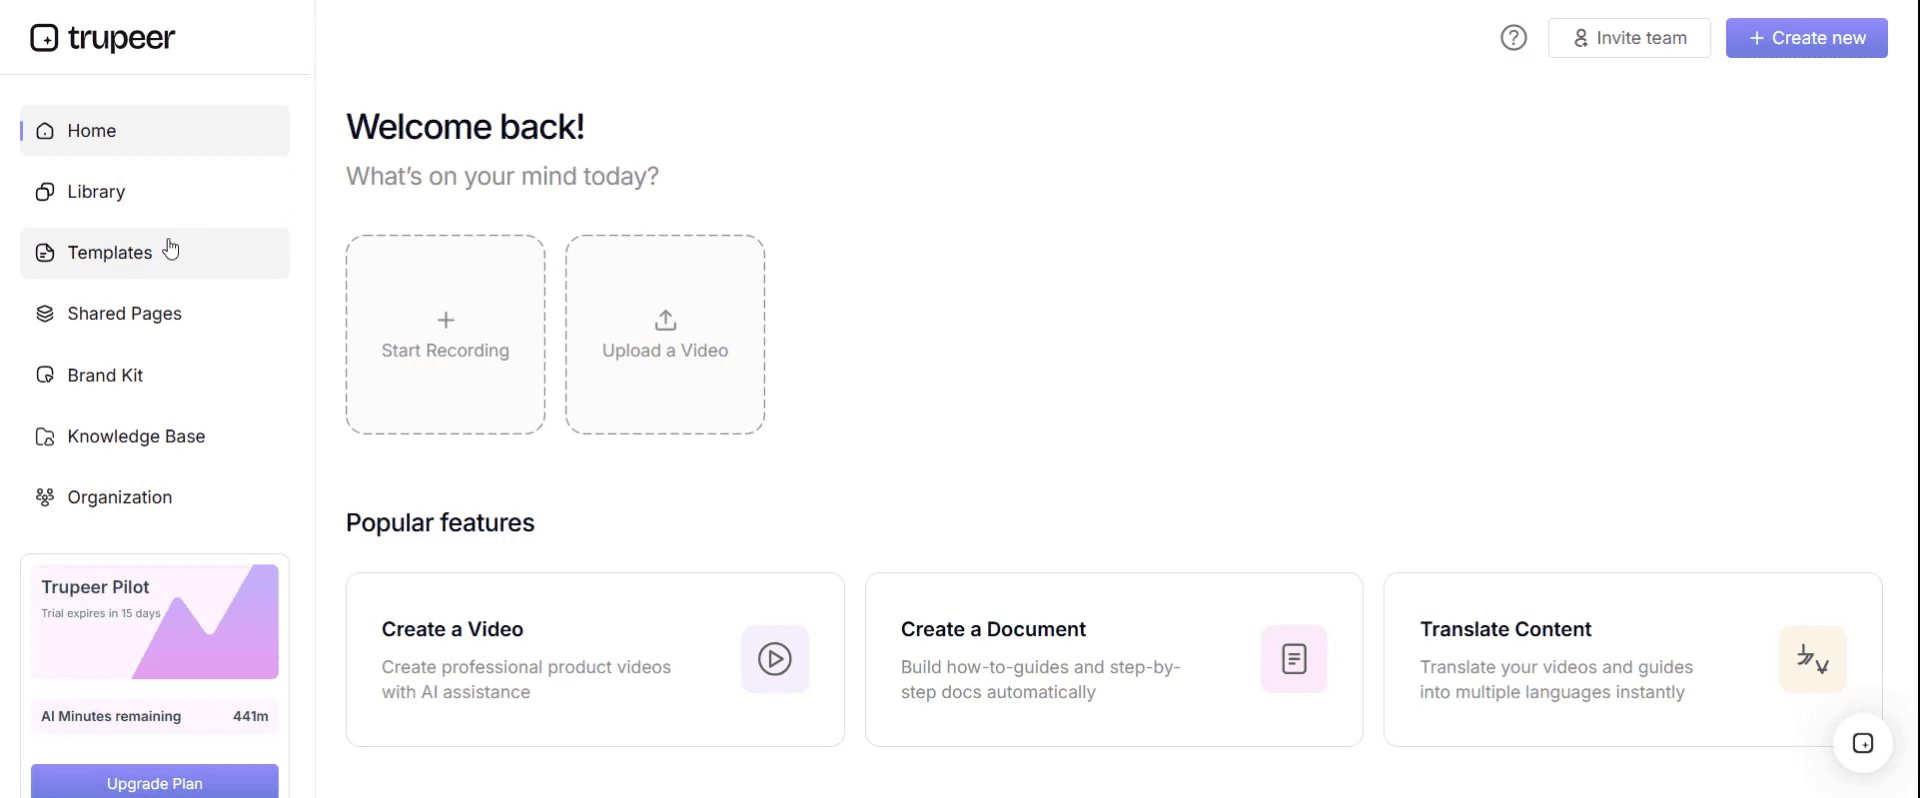
Step 1: Open the Templates Section
Go to the Templates section from the main navigation.
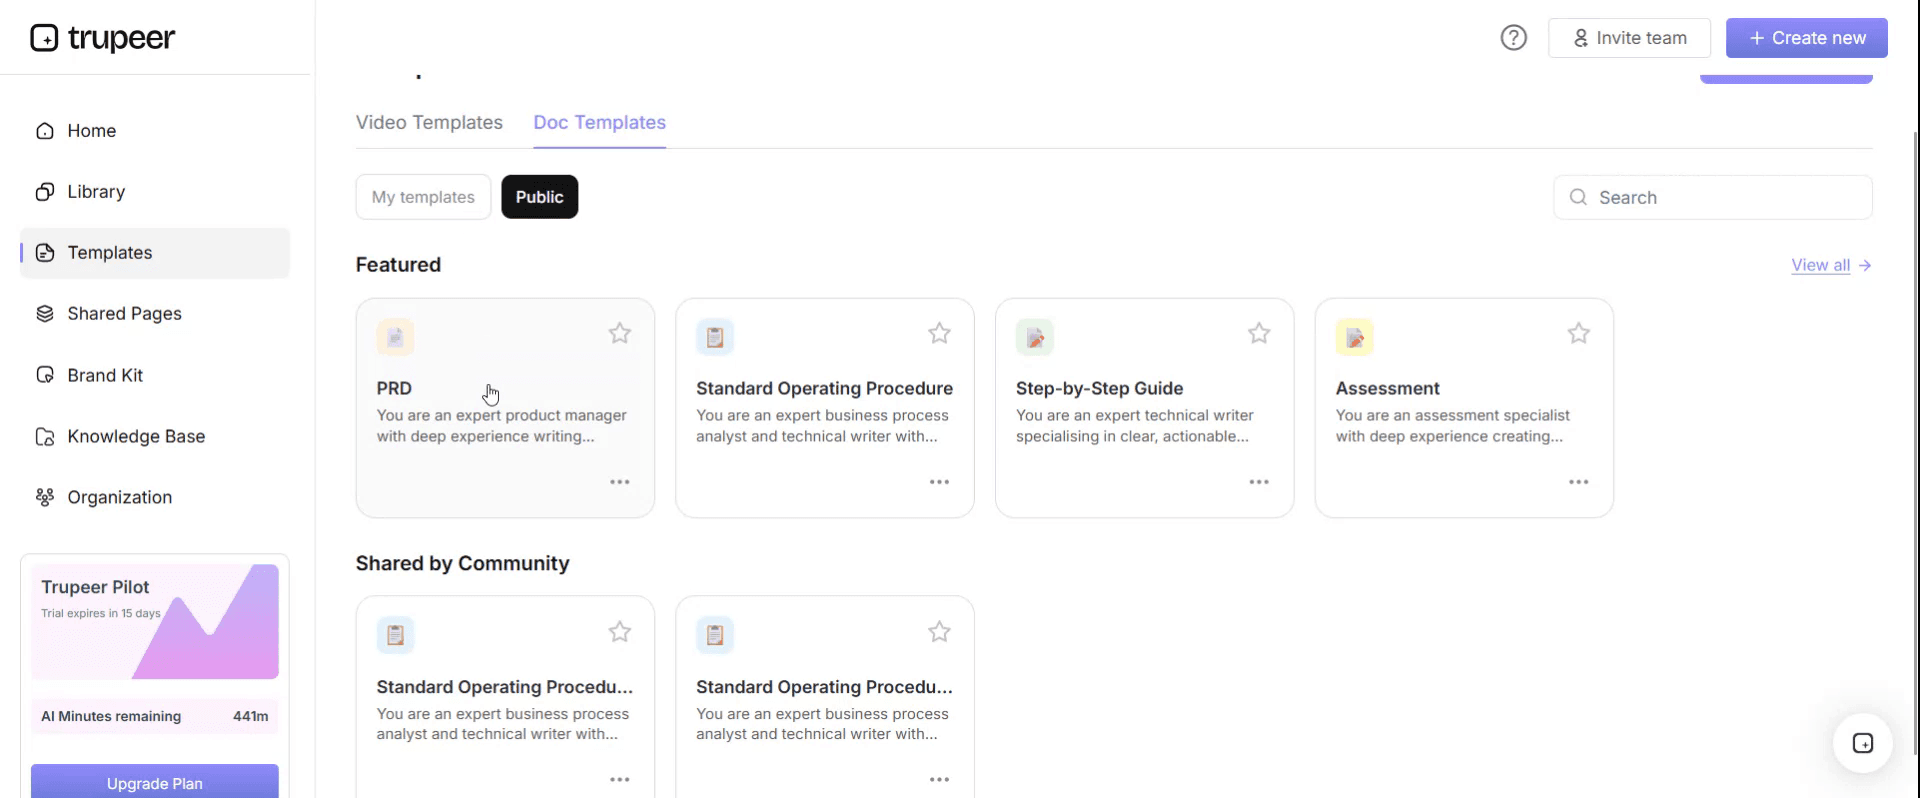
Step 2: Select and Open a Template
Click on any template you want to work with to open it.
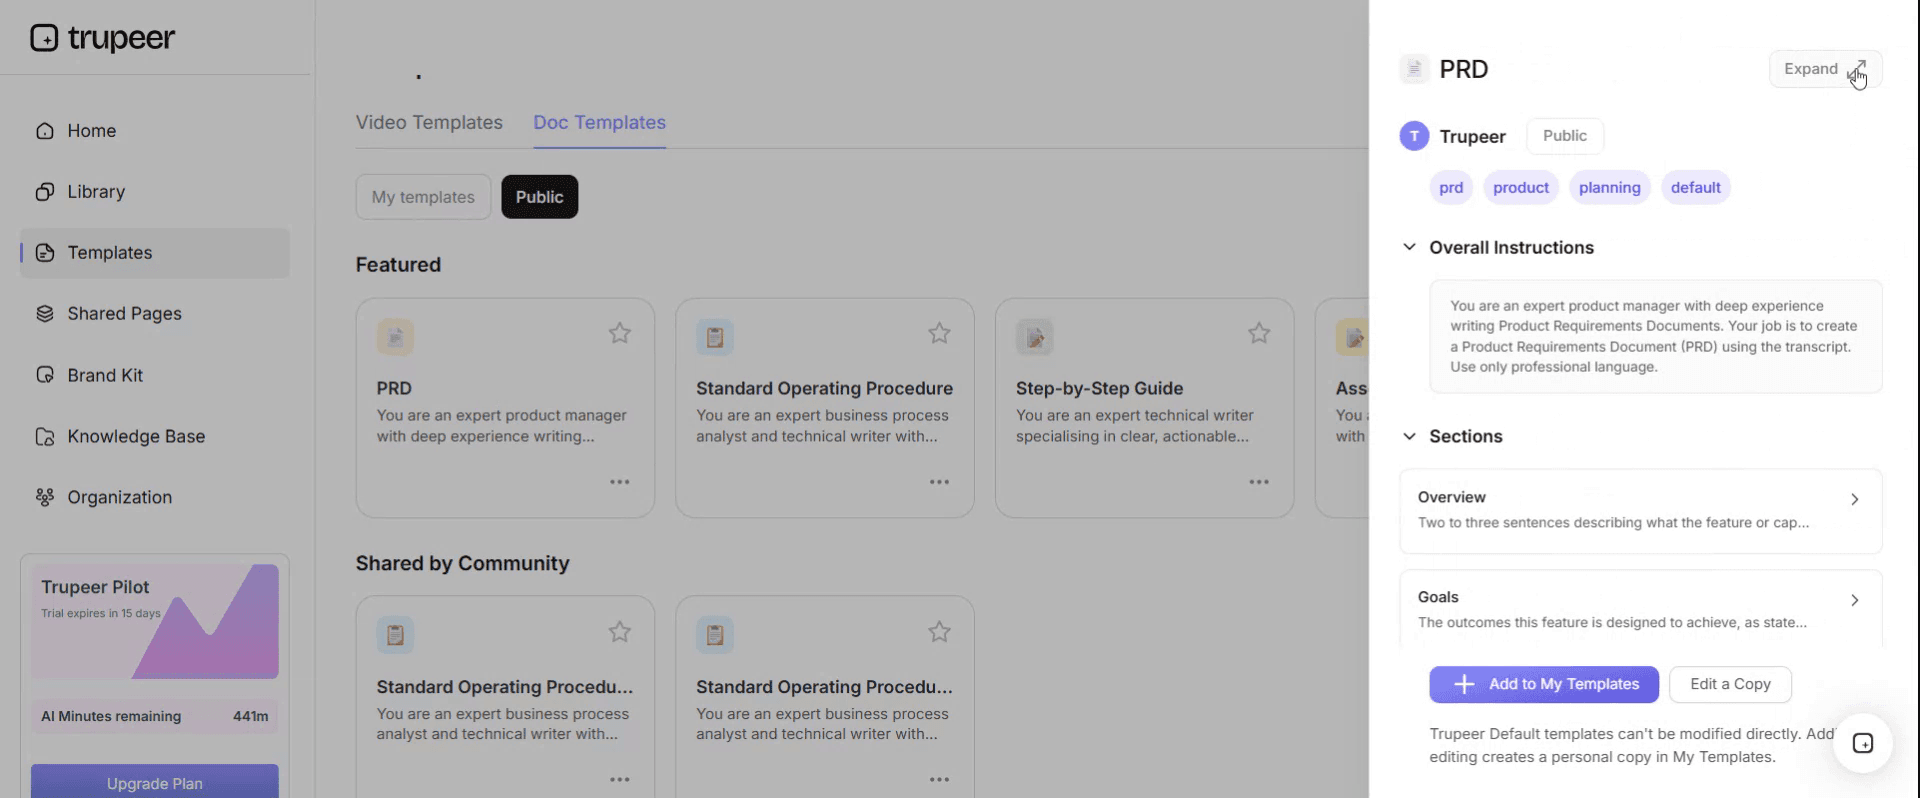
Step 3: Expand the Template View
If needed, expand the template view to see the full layout and details clearly.
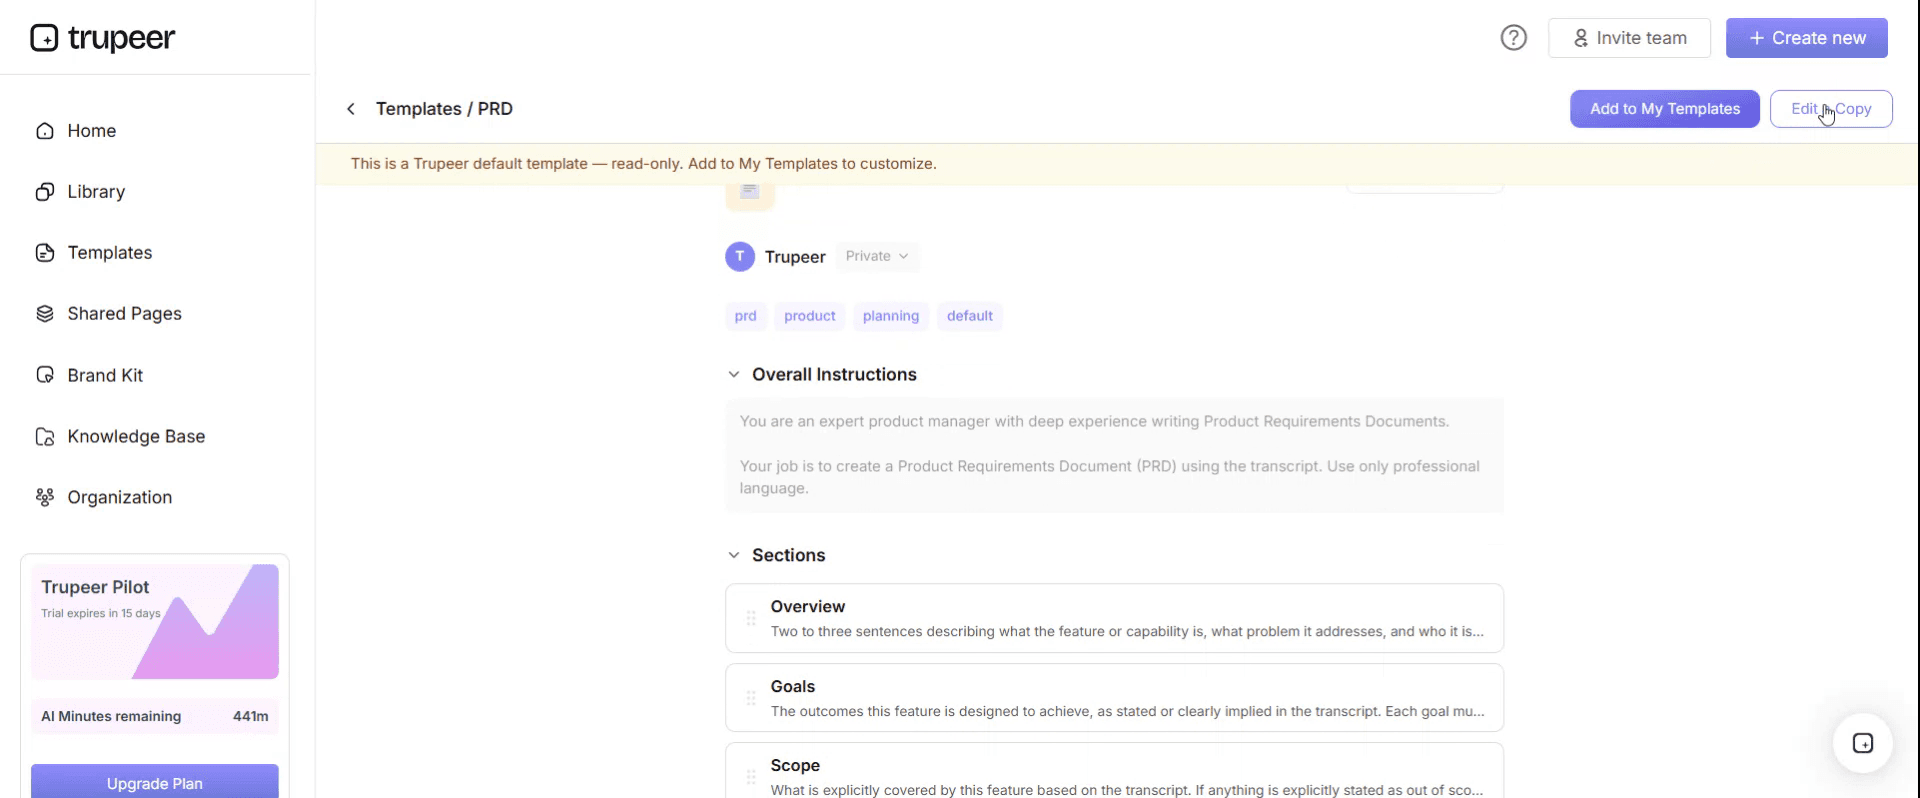
Step 4: Edit the Template
Click on Edit to start modifying the selected template.
Within the editor, you can:
Add new sections
Define or update formatting rules
Add a logo and adjust its position and related settings
Step 5: Save Your Customized Template
After making all necessary changes, click Save to store the updated template as your own.
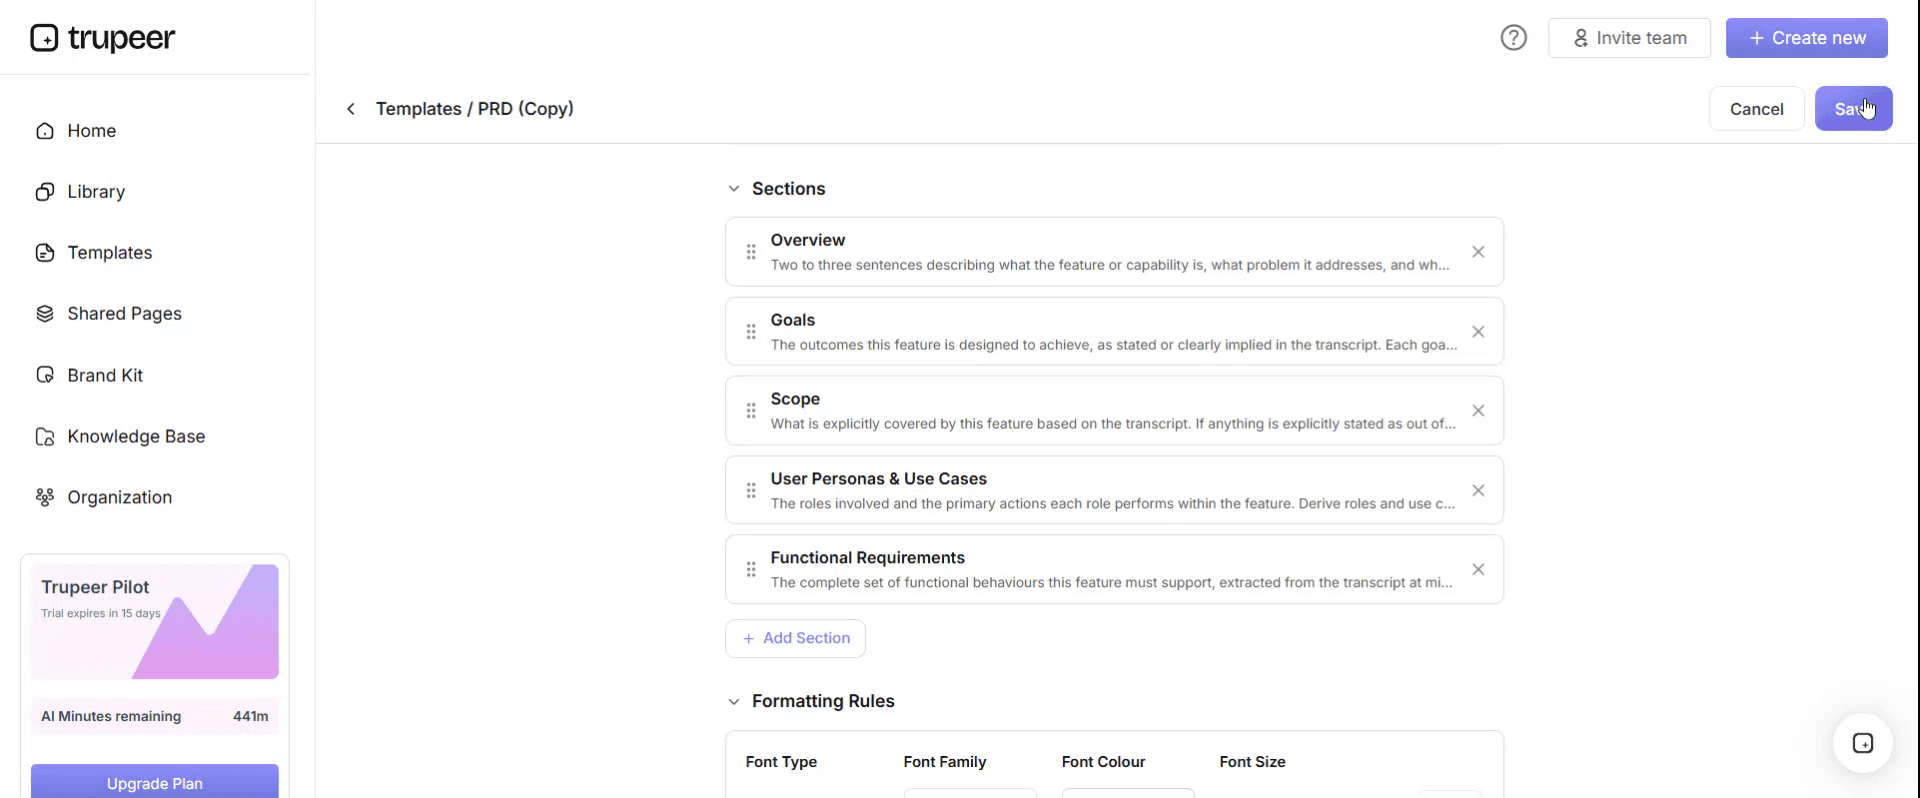
Step 6: Preview and Fine-Tune the Template
When you want to see how your customized template looks, open the Preview.
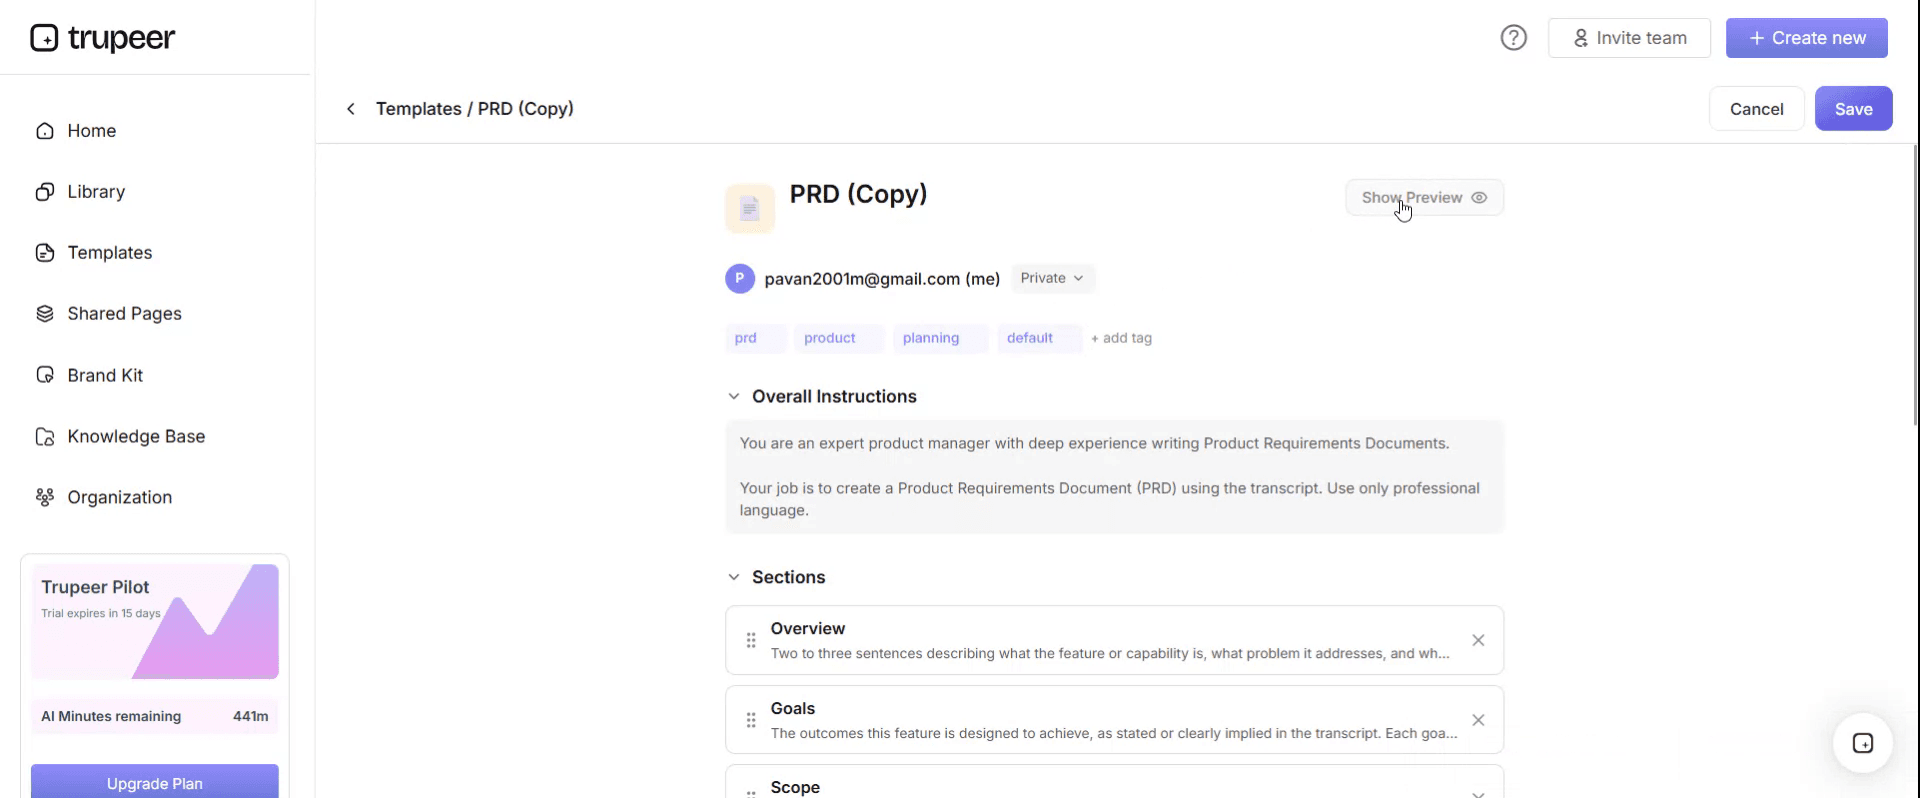
From the preview screen, you can continue to make adjustments directly if needed, ensuring the template appears exactly as you want.
With a process flow template you can:
Save hours on mapping: Skip the blank page with a structure for any workflow.
Visualize complex work: Process flows make decision points, handoffs and bottlenecks visible.
Stay on-brand: Apply your logo, colors and fonts using Trupeer's brand kit.
Improve processes: Mapping a process is the first step to improving it - the template makes inefficiencies obvious.
Train teams faster: Pair process flows with video walkthroughs to onboard new hires quickly.
Reach global teams: Translate process flows into 65+ languages with one click.
Count the decision points before you draw
The quickest version of the test takes two minutes.
Write out the process as a numbered list. Then count the points where somebody has to decide something that changes what happens next. Not steps that could fail, and not approvals that always get given. Genuine forks.
Fewer than three, and the list is your document. Draw a diagram only if you are using it for a conversation, and accept that its life ends when the conversation does.
Three or more, and a diagram earns its place, because the text version will now need cross-references that readers cannot hold in their head.
The reason this matters is maintenance, which nobody thinks about while drawing. Text is edited by anyone in seconds. A diagram needs the tool it was drawn in, a licence for that tool, the source file rather than an exported image, and often a re-layout because inserting one box pushes everything else out of alignment. That asymmetry is why flowcharts go stale faster than any other kind of documentation.
Why most process flows should be thrown away
The most useful reframe available here is that a flowchart is usually a thinking tool, not a document.
Drawn on a wall or a whiteboard with the people who do the work, it does something no text can: it makes the shape of the process visible at once, and the shape is where the waste is. That job is finished within a few hours.
The mistake is what happens next. The diagram gets tidied into a drawing tool, exported, filed, and treated as documentation. From that moment it is a liability, because it will diverge from reality and nobody will notice, and it looks authoritative in a way that a rough sketch does not.
A better habit: photograph the wall, record the decisions it produced in text, and let the diagram go. Redraw it next time you need to see the process, which will take an hour and will show you the current version rather than the one from two years ago.
Keep as a maintained diagram only the flows that meet the branching test and have a named owner who has the tool and the time. In most organisations that is a small number.
Free process flow template: the structure to copy
Copy from here. A usable process flow is a diagram plus a small amount of text, and the text is the part templates omit.
Title. The process, named as an outcome.
Owner and last verified date. A role and a date, meaning when somebody last confirmed the flow matches reality. Diagrams need this more than text does, precisely because they are harder to update.
Start and end. What triggers the process and what condition means it is finished. Written above the diagram, not just drawn as an oval.
Out of scope. What sits immediately either side that this flow does not cover. This is where duplicated diagrams come from.
The diagram. Using standard shapes, laid out left to right or top to bottom, with one entry point and clearly labelled exits.
Decision labels. Every branch labelled with the condition, not just yes and no. "Credit limit exceeded" beats "no".
What is not on the diagram. The exceptions and edge cases that would make it unreadable, listed underneath in text with a pointer from the relevant step.
Source file location. Where the editable version lives and which tool opens it. Diagrams without this become read-only artefacts within a year.
Copy to here.
Key flowchart shapes and what each one means
Shape | Meaning | Common mistake |
|---|---|---|
Rounded rectangle or oval | Start and end points | Multiple start points, which usually means two processes |
Rectangle | A process step, one action | Steps containing several actions joined by "and" |
Diamond | A decision, with labelled exits | Only yes and no exits when reality has three or four outcomes |
Parallelogram | Input or output, data entering or leaving | Used interchangeably with the rectangle, which loses the distinction |
Cylinder | Data store or database | Omitted entirely, so where information lives is invisible |
Arrow | Flow direction | Unlabelled arrows leaving a decision |
Circle or small connector | Continues elsewhere on the page or another page | Used to hide complexity rather than to manage layout |
Two conventions matter more than the shapes themselves. Every diamond needs its exits labelled with conditions rather than yes and no, because the reader arrives at the diamond needing to know what they are testing. And every arrow should lead somewhere; a path that leaves the diagram is either an exception belonging in the text underneath, or a missing step.
Consistency beats correctness here. A team using rectangles for everything but labelling clearly will produce more usable diagrams than one arguing about parallelograms.
When swimlanes earn their place, and when they do not
A swimlane diagram divides the flow into rows or columns, one per role, so that each step sits in the lane of whoever performs it.
They earn their place when the handoffs are the subject. If the question you are trying to answer is who does what, or where does this get stuck, or how many times does this cross between teams, a swimlane answers it immediately and nothing else does.
They do not earn their place when one role does almost everything, which produces a diagram with one busy lane and several empty ones, or when the process is linear, where the lanes add width without adding information.
The practical cost is layout. Swimlanes are the hardest diagram type to edit, because inserting a step shifts everything in every lane. That maintenance burden is the main reason process mapping programmes produce hundreds of swimlanes that nobody ever updates.
If you are mapping to find handoff problems, draw swimlanes, fix the handoffs and keep the fixes rather than the diagrams.
The transformation programme with 340 unmaintained diagrams
Storrington Group, a services business of about eleven hundred people, ran a transformation programme that included mapping how the organisation worked.
Over five months, a consultancy mapped a hundred and twelve processes as swimlane diagrams, producing about three hundred and forty drawings once multiple levels were counted. Fees plus internal time came to something in the region of two hundred and eighty thousand pounds.
Eighteen months later somebody asked how many were still accurate.
A sample of thirty was checked. Four still matched reality. Nineteen contained at least one step that no longer existed. Seven described systems that had since been replaced.
None had been updated. The reasons were entirely practical. Only three people in the programme office had licences for the tool the diagrams were drawn in. The source files sat in a folder nobody outside that team could find. And updating a swimlane meant re-laying out the whole diagram, which took an afternoon for a change that took a minute to describe in words.
The more uncomfortable finding came from counting decision points. Of the hundred and twelve processes mapped, seventy one had fewer than three genuine branches. They were linear. They had been drawn as swimlanes because the programme's template said processes get mapped as swimlanes.
Of the forty one that genuinely branched, six had been used during the programme to make real decisions, removing duplicate approvals and consolidating two handoffs. Those six had already repaid their cost. Perhaps fifteen more were being used for training.
The reset was straightforward. The forty one branching processes were kept as maintained diagrams, moved into a tool everyone already had access to, with a named owner each. The seventy one linear ones were rewritten as numbered text in the knowledge base people already used.
The rule adopted afterwards was the one on this page: draw it if there are three or more genuine decision points, or if you are drawing it to have a conversation, in which case it does not need maintaining.
Twelve months on, thirty four of the forty one maintained diagrams had been updated at least once. A fresh audit of thirty documents found twenty six accurate rather than four.
How to create a process flow, step by step
Write the process as a numbered list first, even if you are certain you want a diagram. It takes ten minutes and it produces the decision count.
If the count justifies a diagram, agree the start and end before drawing anything, because scope disagreement is what makes mapping sessions run long.
Draw the current state with the people who do the work, on a wall or a shared canvas, roughly. Do not tidy it while drawing.
Label every decision exit with a condition.
Note the exceptions in text beside the diagram rather than adding boxes for them, because exceptions are what turn a readable flow into an unreadable one.
Walk it with somebody who performs the process and watch for the phrase "well, sometimes". Every one of those is either a missing branch or an exception for the text.
Then decide, explicitly, whether this diagram is being kept or thrown away. Both are legitimate. Not deciding is what produces a folder of stale drawings.
Types of process flow and flowchart templates
Basic flowchart. Sequential steps with a few decisions. The default and usually correct choice.
Swimlane or cross-functional. Steps allocated by role. For handoff problems, as above.
Decision tree. Branch-heavy, little sequence. Often better expressed as a decision table, which is easier to maintain and just as readable. Our job aid template covers when a table beats a diagram.
Data flow diagram. Shows information moving between stores and processes rather than tasks in sequence. A different notation for a different question.
Value stream map. Adds time, inventory and value-add data to the flow. A lean tool for finding waste rather than a documentation format.
System or architecture flow. Components and interfaces rather than human steps, belonging with your IT documentation.
Current state versus future state. Two diagrams side by side. Genuinely useful for change decisions and rarely worth maintaining afterwards, since the future state becomes the current state or is abandoned.
Can I get a flowchart template in Word, PowerPoint or Excel?
PowerPoint is the most practical of the three for a diagram most people will need to edit. Almost everyone has it, shapes and connectors behave reasonably, and connectors stay attached when boxes move.
Word can produce a flowchart and it is awkward past about a dozen boxes, because the drawing canvas fights the text flow. It is a good choice when the diagram is small and belongs inside a larger document.
Excel is the wrong tool for the diagram and the right tool for two things around it: the process register listing every flow with its owner, last verified date and decision count, and any decision table you extract from a branch-heavy diagram.
PDF for the issued version. The important thing is that the source file remains accessible and is named in the document, because a PDF flowchart with no editable original is a diagram that will never be updated.
Whatever you choose, pick a tool everyone who might update the diagram already has. The Storrington example above failed on licences more than on effort.
Can ChatGPT or AI tools create a flowchart?
They can produce a first draft, and it is a genuinely useful starting point. Describe a process in plain language and most current models will return a diagram in a text notation such as Mermaid or a structured description you can paste into a diagramming tool.
Two limits are worth knowing. The model is drawing the process you described, not the process you have, so it will reproduce your happy path and any gaps in your own understanding. And it has no way of knowing which branches are real, so it tends to produce clean symmetrical decisions where reality has three uneven outcomes.
The practical use is to get to a rough diagram in two minutes so that a conversation with the people who do the work can start from something concrete. Treat the output as a prompt for that conversation rather than as a map.
What to keep as text instead of a diagram
The parts of a process that consistently belong in words rather than boxes.
Exceptions and edge cases, which are the fastest way to make a diagram unreadable.
Decision rules with any complexity, meaning anything with thresholds, values or multiple conditions. A diamond saying "credit check" hides a rule that needs three lines of text.
Anything requiring judgement rather than a test, since a diagram implies a determinate answer.
Field level detail, system names, and the specifics of what gets entered where. Those belong in the procedure the diagram sits above.
And the reason the process exists, which belongs in a policy rather than in either.
A good pairing is a one page diagram showing the shape and the branches, with the procedure underneath carrying the detail. Our SOP template covers that lower layer.
How to document the process the flowchart cannot
Worth saying plainly: Trupeer AI does not draw flowcharts. It records what somebody does on screen and turns it into a written guide and a video. For the diagram itself you want a diagramming tool, and several good free ones exist.
Where it does help is the half of the work a flowchart cannot carry. Once your diagram shows the shape and the branches, somebody still has to describe what actually happens inside each box, and that description is what people need at the moment they are doing the work rather than reviewing the process.
Recording the task once produces that written detail with the steps and screens already captured, which is considerably faster than writing it and much more likely to be accurate. It also handles the exceptions well, since the practical approach is to record them as they occur rather than trying to remember them later.
Record it. Brand it. Translate it. Trupeer it.
The output lives in your knowledge base in consistent branding alongside the diagram, and the SOP creator covers procedures that need controlling. Setup instructions are in the document template setup guide.
Frequently Asked Questions
Is there a free process flow template in PowerPoint?
PowerPoint is a reasonable choice and most people already have it. Build one slide with your standard shapes and connector styles and save it as your house template. The advantage over a dedicated tool is purely practical: anyone who needs to update the diagram can open it without a licence request.
Is there a flowchart template for Word?
Word handles small flowcharts inside a larger document, using the drawing canvas so shapes stay grouped. Past about a dozen boxes it becomes frustrating and the diagram is better built elsewhere and inserted as an image, with the source file location noted in the document so somebody can update it later.
Is there a process flow chart template in Excel?
Excel can draw one and rarely should. Its useful role here is the register: every process flow with owner, last verified date, decision point count and where the source file lives. That register is what stops a library of diagrams quietly going stale, which is the failure described in the worked example above.
Is there a free process flow template in PDF?
Export to PDF for circulation and for anything going into an audit or a pack. Always name the source file and its location on the diagram itself, because a PDF flowchart with no reachable original is a document nobody can maintain.
How many boxes should a flowchart have?
Fifteen to twenty on a page is about the readable limit. Beyond that, either split into a high level flow with linked sub-flows, or accept that the process is better expressed as text with a small diagram showing only the branches. Diagrams with sixty boxes are usually produced to demonstrate thoroughness rather than to be read.
What is the difference between a process flow and a process map?
In practice the terms are used interchangeably. Where organisations distinguish them, a process flow is the sequence of steps, and a process map is broader, adding roles, systems, inputs, outputs and sometimes timing and volume data. A value stream map goes further again by adding waiting time and value-add analysis.
Who should own a process flowchart?
A named role with the tool, the access and the time to update it. That is a higher bar than it sounds and it is the reason most diagrams go stale. If you cannot name someone who satisfies all three, do not create the diagram as a maintained document.
How often should a process flow be updated?
On triggers rather than a schedule: when a system changes, when a handoff moves between teams, when a new branch appears, or when the process owner changes. Add a last verified date and re-check it annually, which for a diagram usually means walking it with somebody who performs the process rather than reading it.