

Jiraでベロシティチャートを作成する
Jira でベロシティチャートを作成して、スプリントごとのチームのパフォーマンスを追跡する方法を学びましょう。完了したストーリーポイントを可視化し、スプリント計画を改善するためのステップバイステップガイドです。
Jira で Velocity Chart を作成するには、Scrum プロジェクトに移動し、次に Reports セクションにアクセスして、そこで Velocity Chart を見つけて選択します。このチャートは、各スプリントにコミットされた総見積もり作業量と完了した作業量を比較して、チームの進捗を可視化します。これは、スプリント計画やチームのキャパシティの把握に役立ちます。
以下で、より詳細に説明します:
1. Velocity Chart へのアクセス:
Jira の該当する Scrum プロジェクトに移動します。
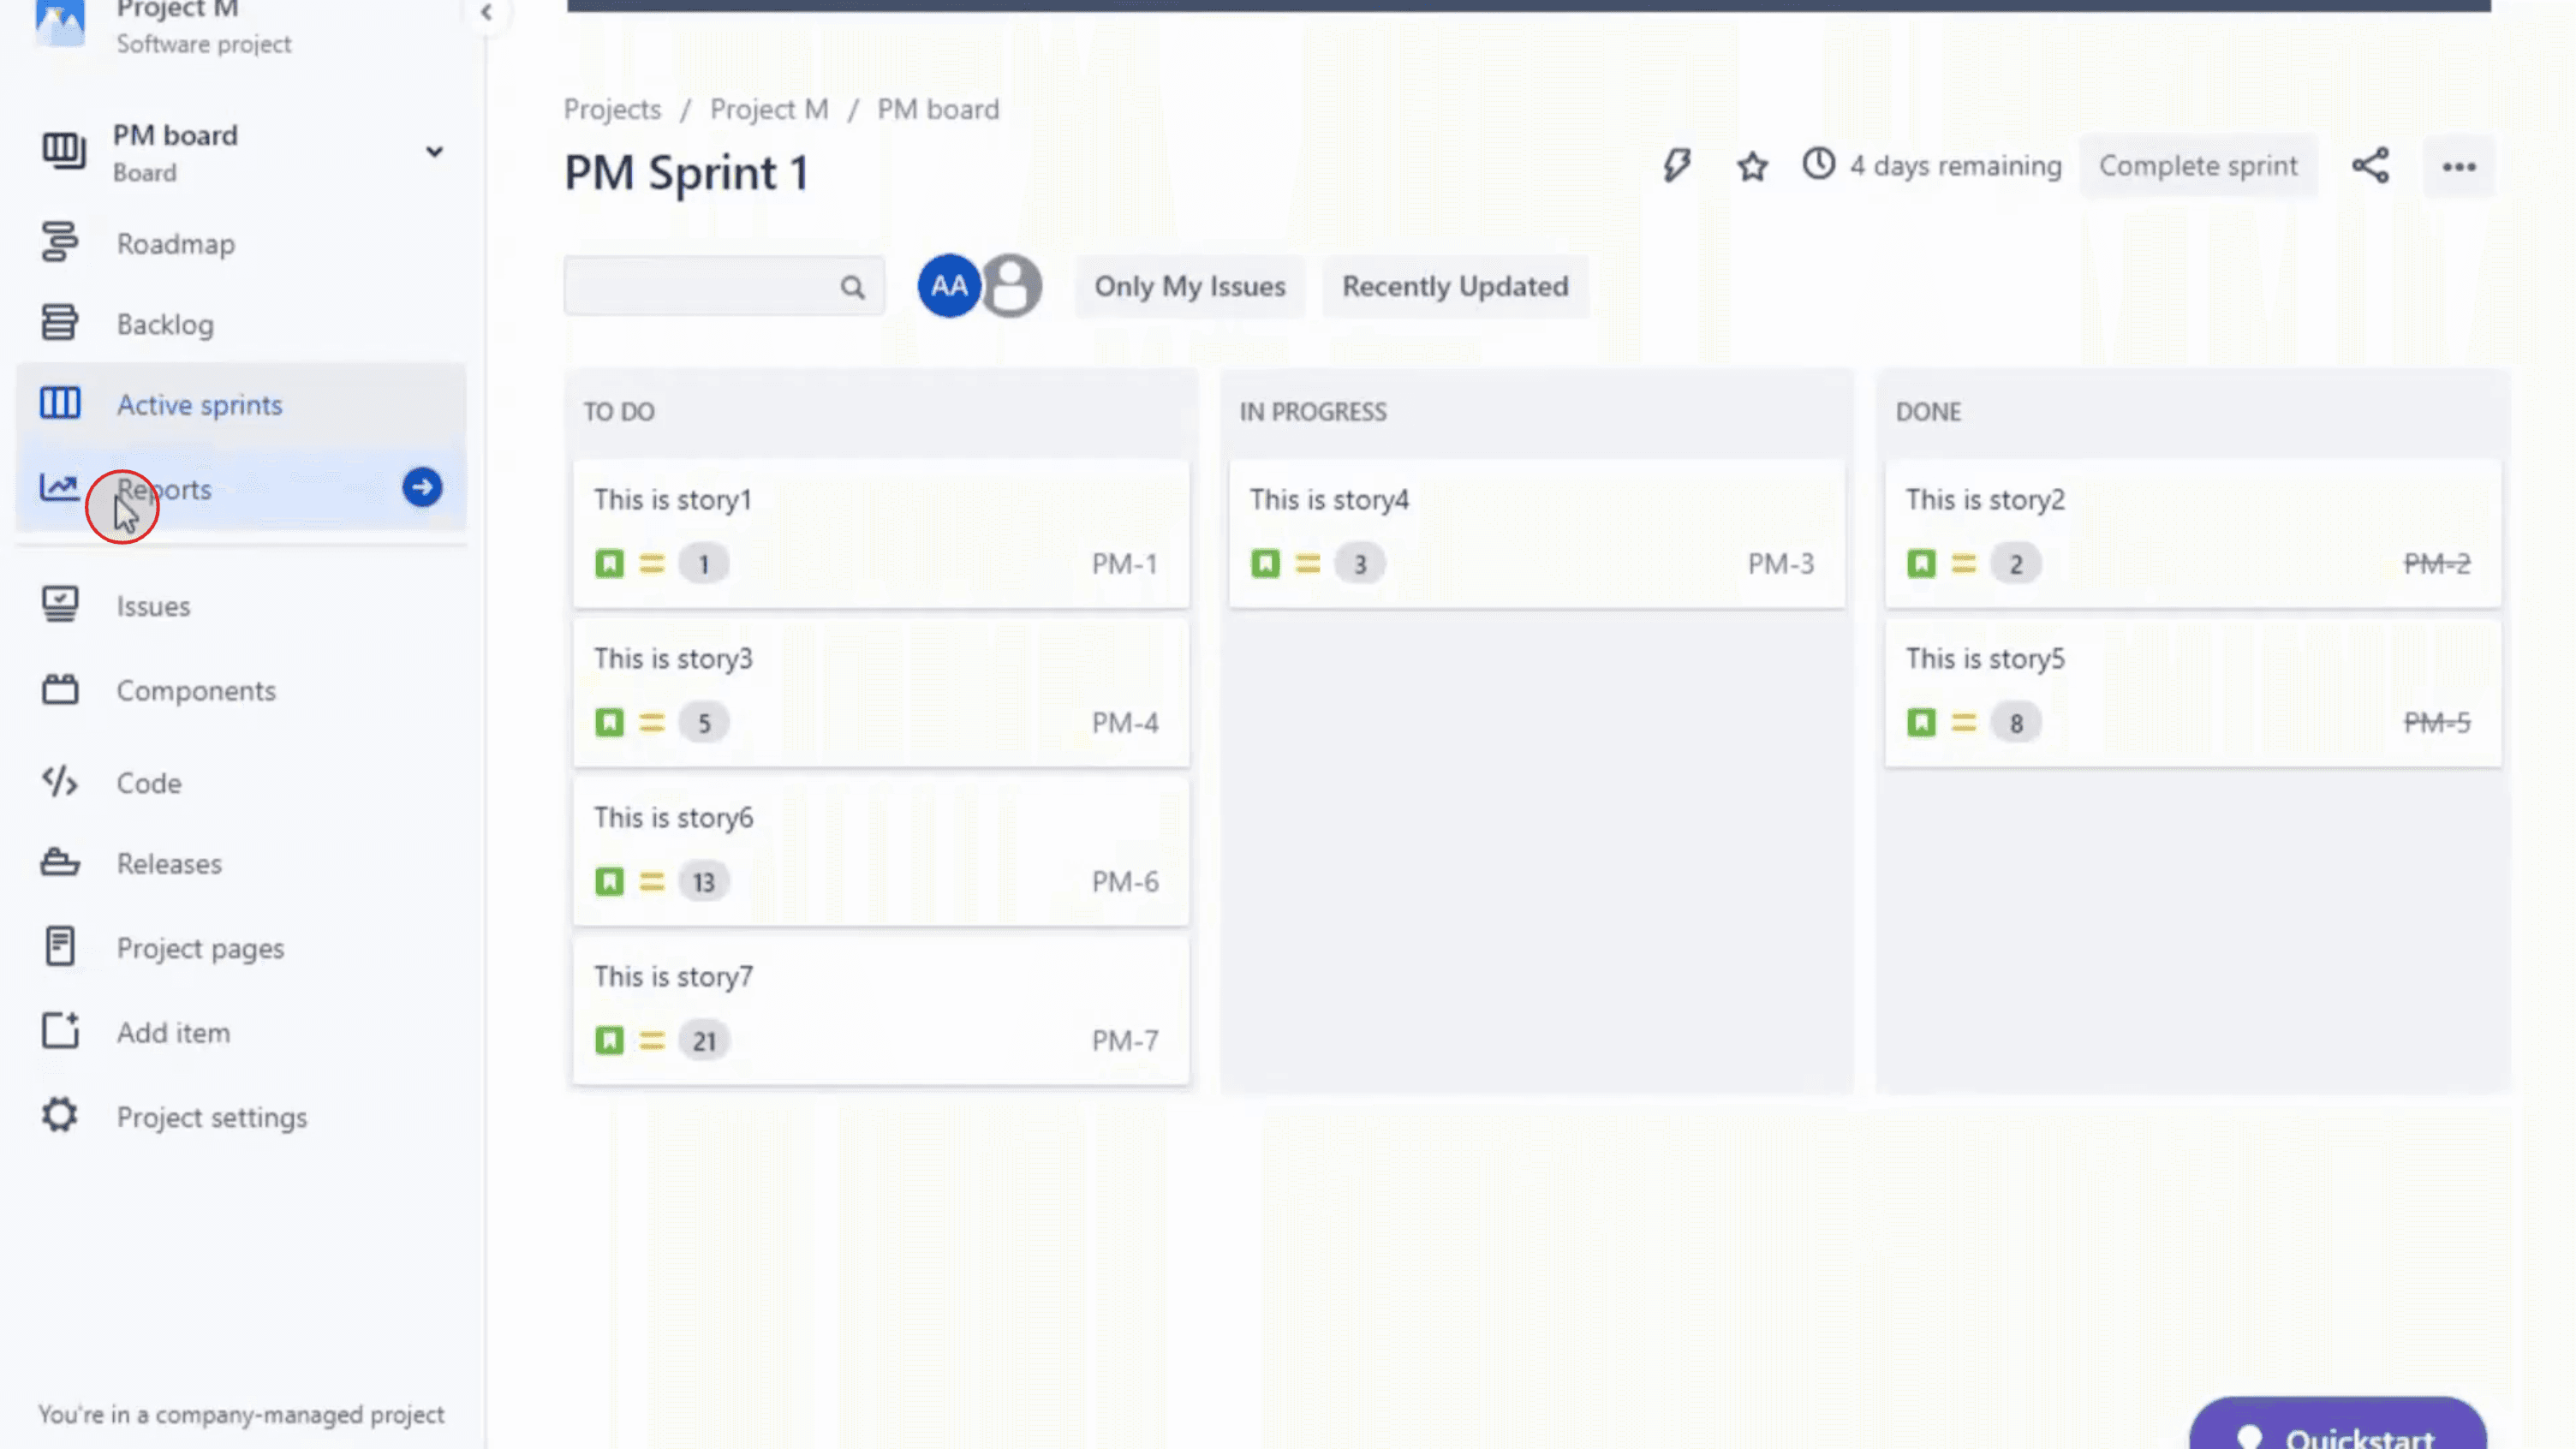
左側サイドバーの「Reports」をクリックします。
利用可能なレポート一覧から「Velocity Chart」を選択します。
2. チャートの理解:
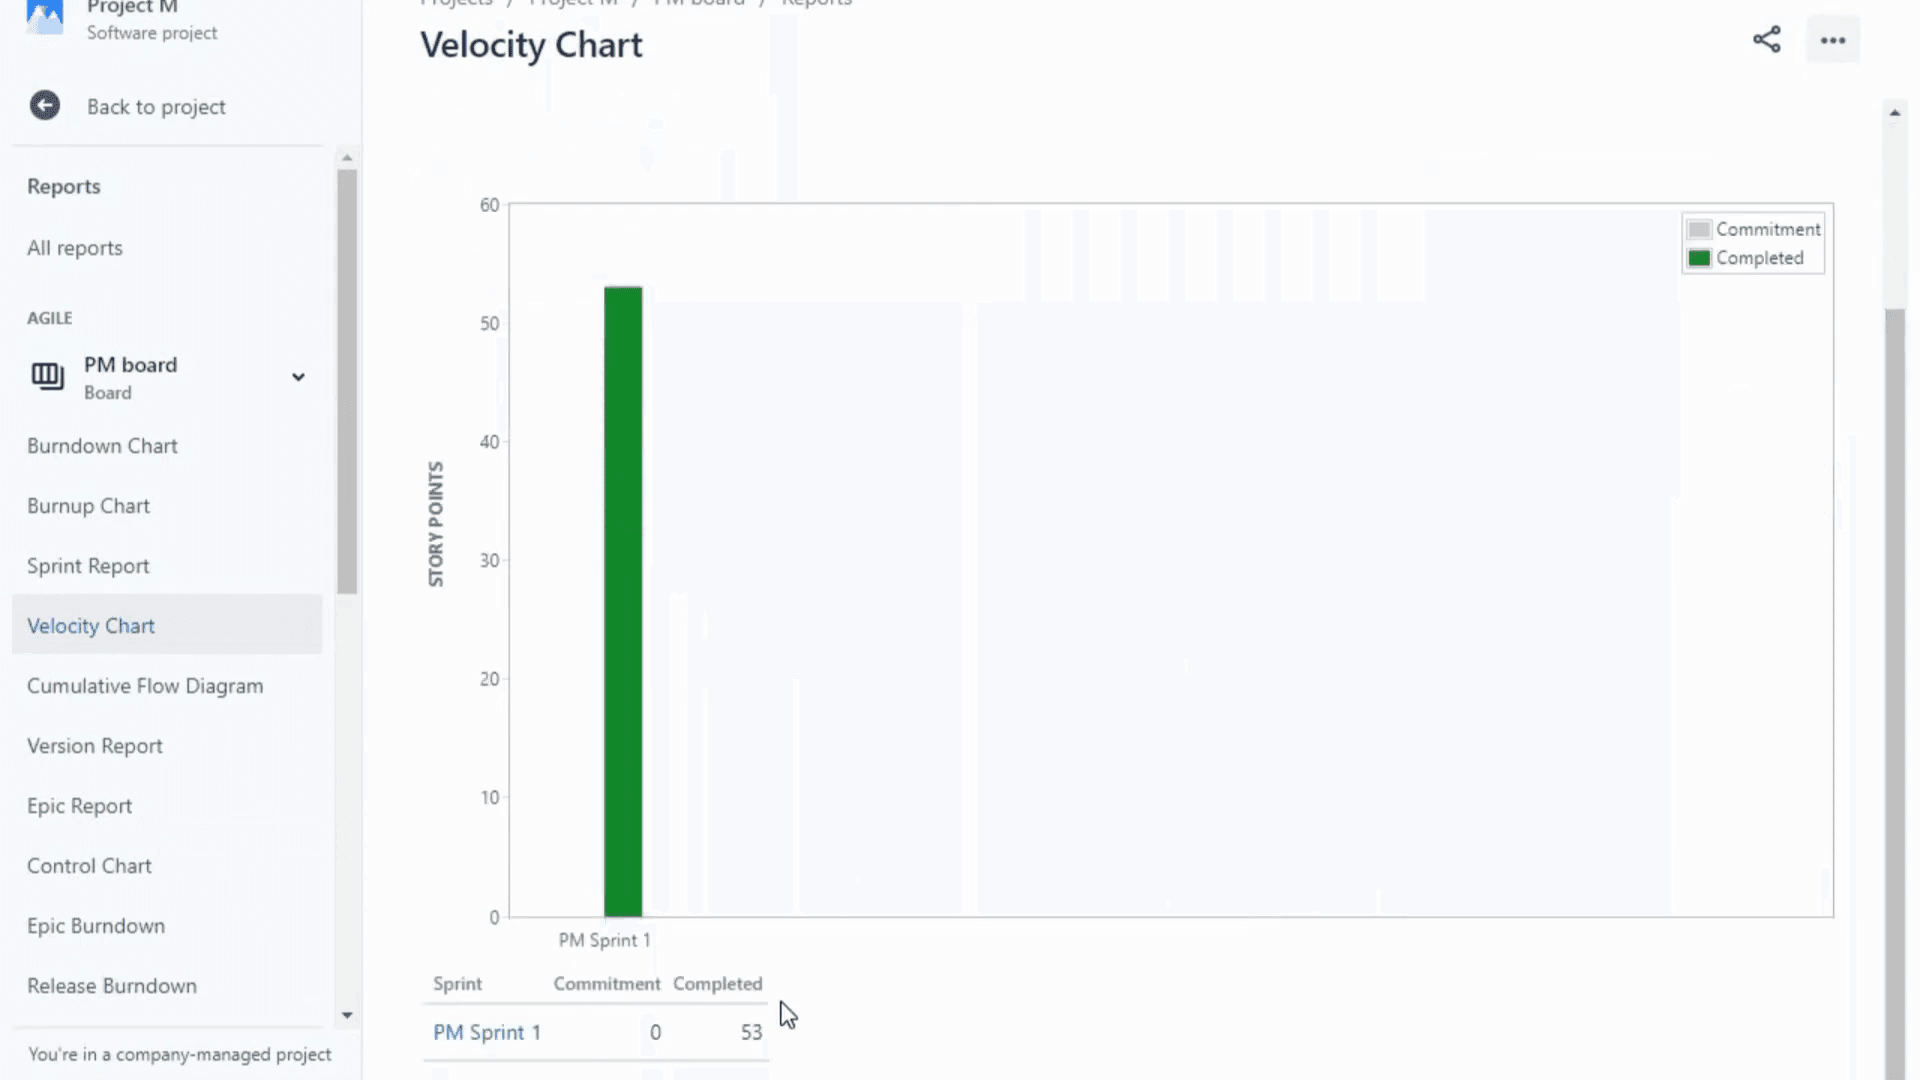
Y 軸は選択した見積もり値(例:ストーリーポイント、課題数など)を表します。
灰色の棒は、各スプリントの総見積もり作業量を示します。
緑色の棒は、各スプリントの完了作業量を示します。
3. Velocity Chart の活用:
スプリント計画: 過去のスプリントで完了した作業を確認することで、次のスプリントでチームがどれだけの作業をこなせるかをより正確に見積もれます。
進捗追跡: チャートはスプリント全体を通してチームの進捗を視覚的に追跡し、過剰なコミットや不足の可能性を浮き彫りにします。
履歴データ: Jira では通常、直近 7 スプリントが保持され、ベロシティ傾向の履歴として参照できます。
問題の特定: コミット済み作業と完了作業の間に大きな差がある場合、過剰なコミット、スコープの肥大化、見積もりの問題などの潜在的な課題を示している可能性があります。
Jira で Velocity Chart を作成するためのステップバイステップガイド
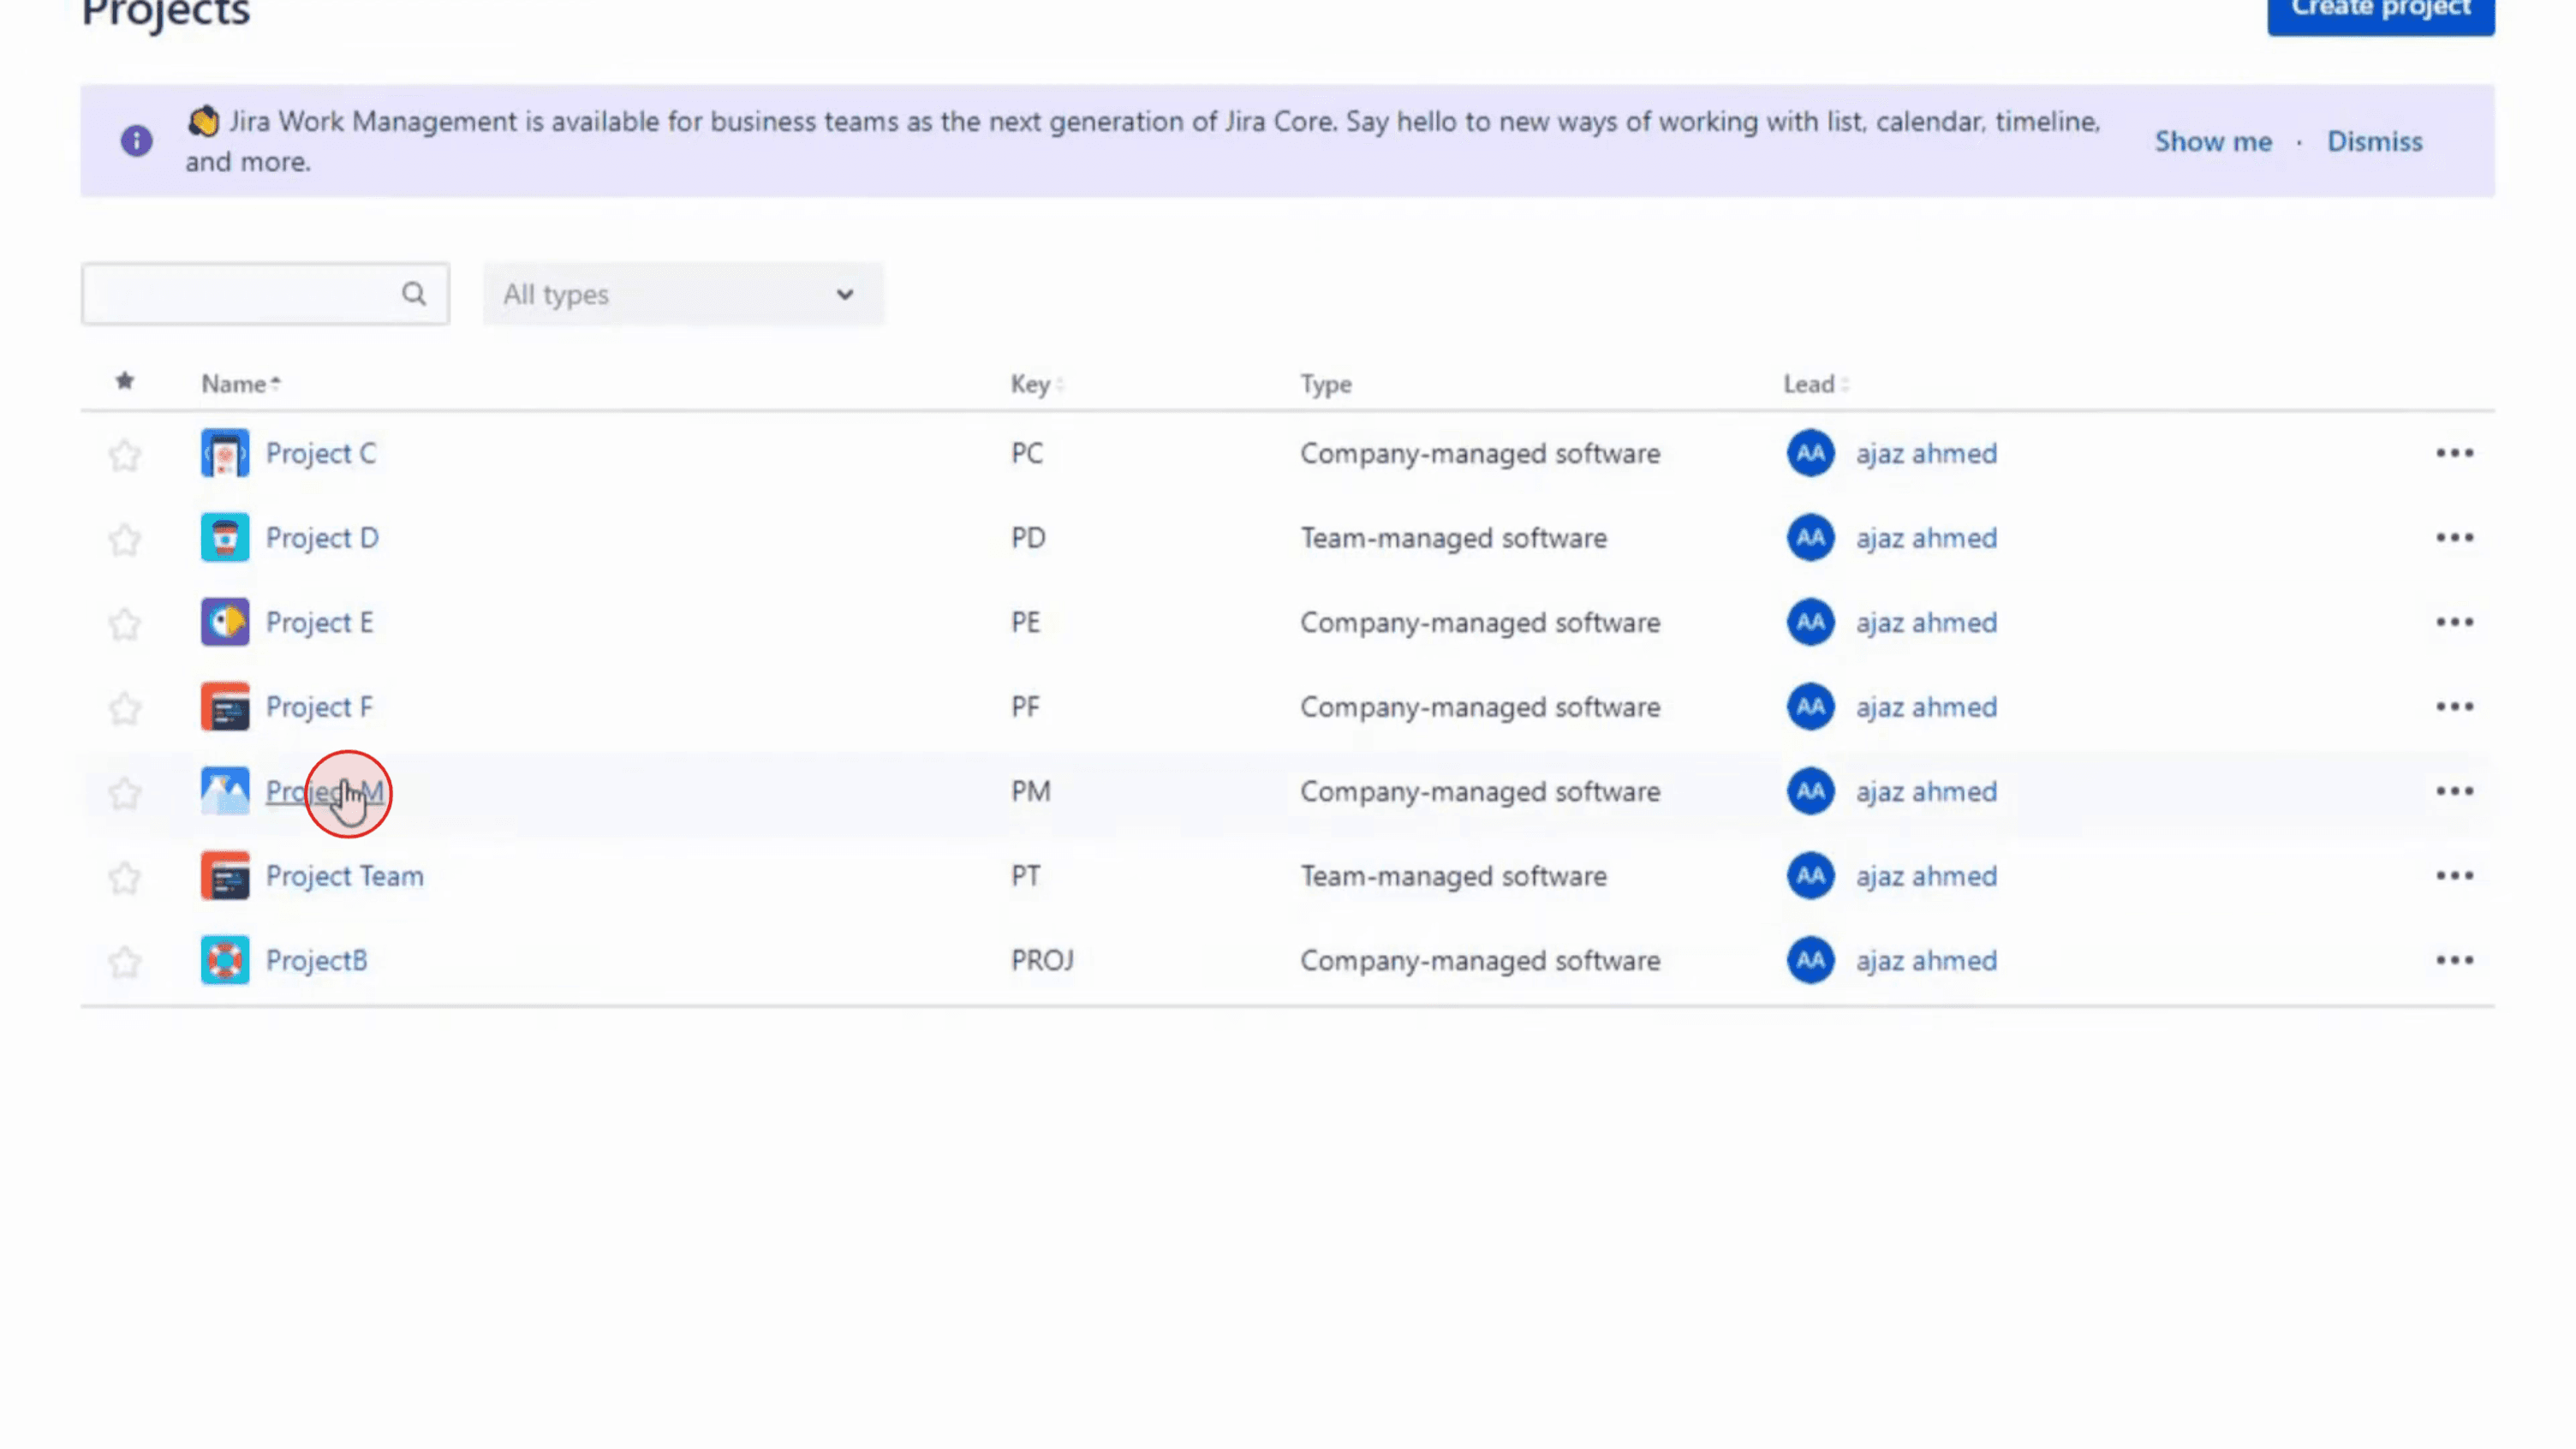
ステップ 1
Velocity Chart を作成したいプロジェクトに移動します。
ステップ 2
左側サイドバーまたはプロジェクトメニューの「Reports」をクリックします
ステップ 3
Reports セクションで、利用可能なレポート一覧から「Velocity Chart」を見つけて選択します。

ステップ 4
これらの手順に従うことで、Jira で Velocity Chart を効果的に作成・活用し、チームのパフォーマンスを長期的に追跡・管理できます。
Jiraでベロシティチャートを作成するためのプロのヒント
Jiraアカウントにログインする
Jiraのワークスペースに移動し、アカウントの認証情報でサインインします。関連するスクラムボードを選択する
プロジェクトのダッシュボードから、ベロシティチャートを表示したいプロジェクトに関連付けられたスクラムボードを選択します。左サイドバーの[Reports]をクリックする
スクラムボードのサイドバーメニューで[Reports]をクリックすると、Jiraで利用できるさまざまなアジャイルレポートを表示できます。ベロシティチャートのオプションを選択する
利用可能なレポートの一覧から「Velocity Chart」を選択します。過去のスプリントにわたる完了済み作業とコミット済み作業を示すチャートが開きます。表示されるデータを理解する
チャートには、各スプリントの開始時点でコミットされたストーリーポイント(または他の見積もり単位)の量と、終了時点で実際に完了した量が表示されます。ドロップダウンを使って期間を選択する
特定のスプリントに絞り込みたい場合は、ドロップダウンメニューまたはフィルターを使って、チャートに含める直近のスプリント数を選択します。チームのベロシティを分析する
チャートを使って、チームの見積もり作業量と完了済み作業量を比較します。これにより、将来のスプリントでチームがどれだけの作業をこなせるかを予測できます。
よくある落とし穴とその回避方法
スクラムではなくカンバンボードを使用している
ベロシティチャートはスクラムボードでのみ利用できます。プロジェクトでカンバンを使用している場合、このレポートは利用できません。見積もり値が設定されていない
ベロシティチャートには、バックログ項目にストーリーポイントまたは他の見積もり単位を追加する必要があります。見積もりがないと、チャートは空白のまま表示されます。スプリント設定が不完全である
ボード上でスプリントが適切に開始・完了していることを確認してください。そうでないと、チャートに有用なデータが表示されません。表示するスプリント数が少なすぎる
チームが完了したスプリントが1つか2つしかない場合、ベロシティチャートに傾向は表示されません。より適切な分析のために、いくつかのスプリントが完了するまで待ちましょう。チャートを誤解する
ベロシティは固定値ではなく、あくまで目安であることを忘れないでください。納期を保証するためではなく、作業容量を計画するために傾向を利用しましょう。
Jira のベロシティチャートに関するよくある質問
Jira のベロシティチャートとは何ですか?
チームが各スプリントでどれだけの作業を約束し、実際にどれだけ完了したかを示すチャートで、将来のパフォーマンス予測に役立ちます。Kanban ボードでベロシティチャートを使用できますか?
いいえ、ベロシティチャートは Jira の Scrum ボードでのみサポートされています。ベロシティチャートではストーリーポイントはどのように計算されますか?
Jira は、各スプリントの開始時にコミットされた課題と、スプリント終了時までに完了した課題のストーリーポイントを合計します。ベロシティチャートが空白なのはなぜですか?
見積もり値を追加していないか、スプリントが正しく設定または完了していない可能性があります。ベロシティチャートをカスタマイズできますか?
組み込みチャートのカスタマイズ性は高くありませんが、詳細なレポートには Atlassian Marketplace のサードパーティアプリを使用できます。Mac で画面録画するには?
Mac で画面録画するには、Trupeer AI を使用できます。画面全体をキャプチャでき、AI アバターの追加、ボイスオーバーの追加、動画の拡大・縮小などの AI 機能も利用できます。trupeer の AI 動画翻訳機能を使えば、動画を 30 以上の言語に翻訳できます。画面録画に AI アバターを追加するには?
画面録画に AI アバターを追加するには、AI 画面録画ツールを使う必要があります。Trupeer AI は AI 画面録画ツールで、複数のアバターを使った動画作成を支援し、さらに動画用の独自アバターの作成もサポートします。Windows で画面録画するには?
Windows で画面録画するには、標準の Game Bar(Windows + G)や、AI アバター、ボイスオーバー、翻訳などのより高度な機能を備えた Trupeer AI のような高度な AI ツールを使用できます。動画にボイスオーバーを追加するには?
動画にボイスオーバーを追加するには、trupeer ai の Chrome 拡張機能をダウンロードしてください。登録後、音声付きの動画をアップロードし、trupeer から希望のボイスオーバーを選択して、編集済み動画を書き出します。画面録画でズームインするにはどうすればよいですか?
画面録画中にズームインするには、Trupeer AI のズーム効果を使用します。これにより、特定の瞬間に拡大・縮小でき、動画コンテンツの視覚的なインパクトを高められます。
こちらもよくある質問
関連チュートリアル

