

كيفية إنشاء مخطط دائري في Figma
هل تريد عرض البيانات بصريًا في Figma؟ تعلّم كيف تنشئ مخططًا دائريًا باستخدام الأشكال والزوايا والإضافات. دليل بسيط لإنشاء تصاميم واضحة ومبنية على البيانات.
إليك تفصيلًا أكثر دقة:
1. أنشئ شكلًا بيضاويًا: حدِّد أداة الشكل البيضاوي وارسم دائرة. يمكنك الضغط مع الاستمرار على Shift أثناء السحب للتأكد من أنها دائرة مثالية.
2. الوصول إلى خيارات القوس: مرّر المؤشر فوق الدائرة، وسترى نقطة تظهر. انقر واسحب هذه النقطة لإظهار أدوات التحكم بالقوس.
3. اضبط الامتداد والبداية: تتيح لك أدوات التحكم بالقوس تعديل "الامتداد" (حجم الشريحة) و"البداية" (زاوية البدء) للقوس.
4. أنشئ شرائح: انسخ القوس الأولي (الشريحة) لإنشاء شرائح إضافية لـ المخطط الدائري الخاص بك. اضبط زوايا الامتداد والبداية لكل نسخة لإنشاء النسب المطلوبة.
5. لوّن الشرائح: املأ كل شريحة بلون مميز لتمييزها. يمكنك أيضًا إضافة تسميات إلى كل شريحة باستخدام أداة النص.
6. رتّب وحسّن: رتّب الشرائح والتسميات حسب الحاجة. يمكنك تجميع العناصر للحفاظ على تنظيم المخطط.
دليل خطوة بخطوة: كيفية إنشاء مخطط دائري في Figma
الخطوة 1
انقر على قسم "الإجراءات".

الخطوة 2
عندما يظهر خيار المخطط الدائري، ما عليك سوى النقر عليه لتحديده.

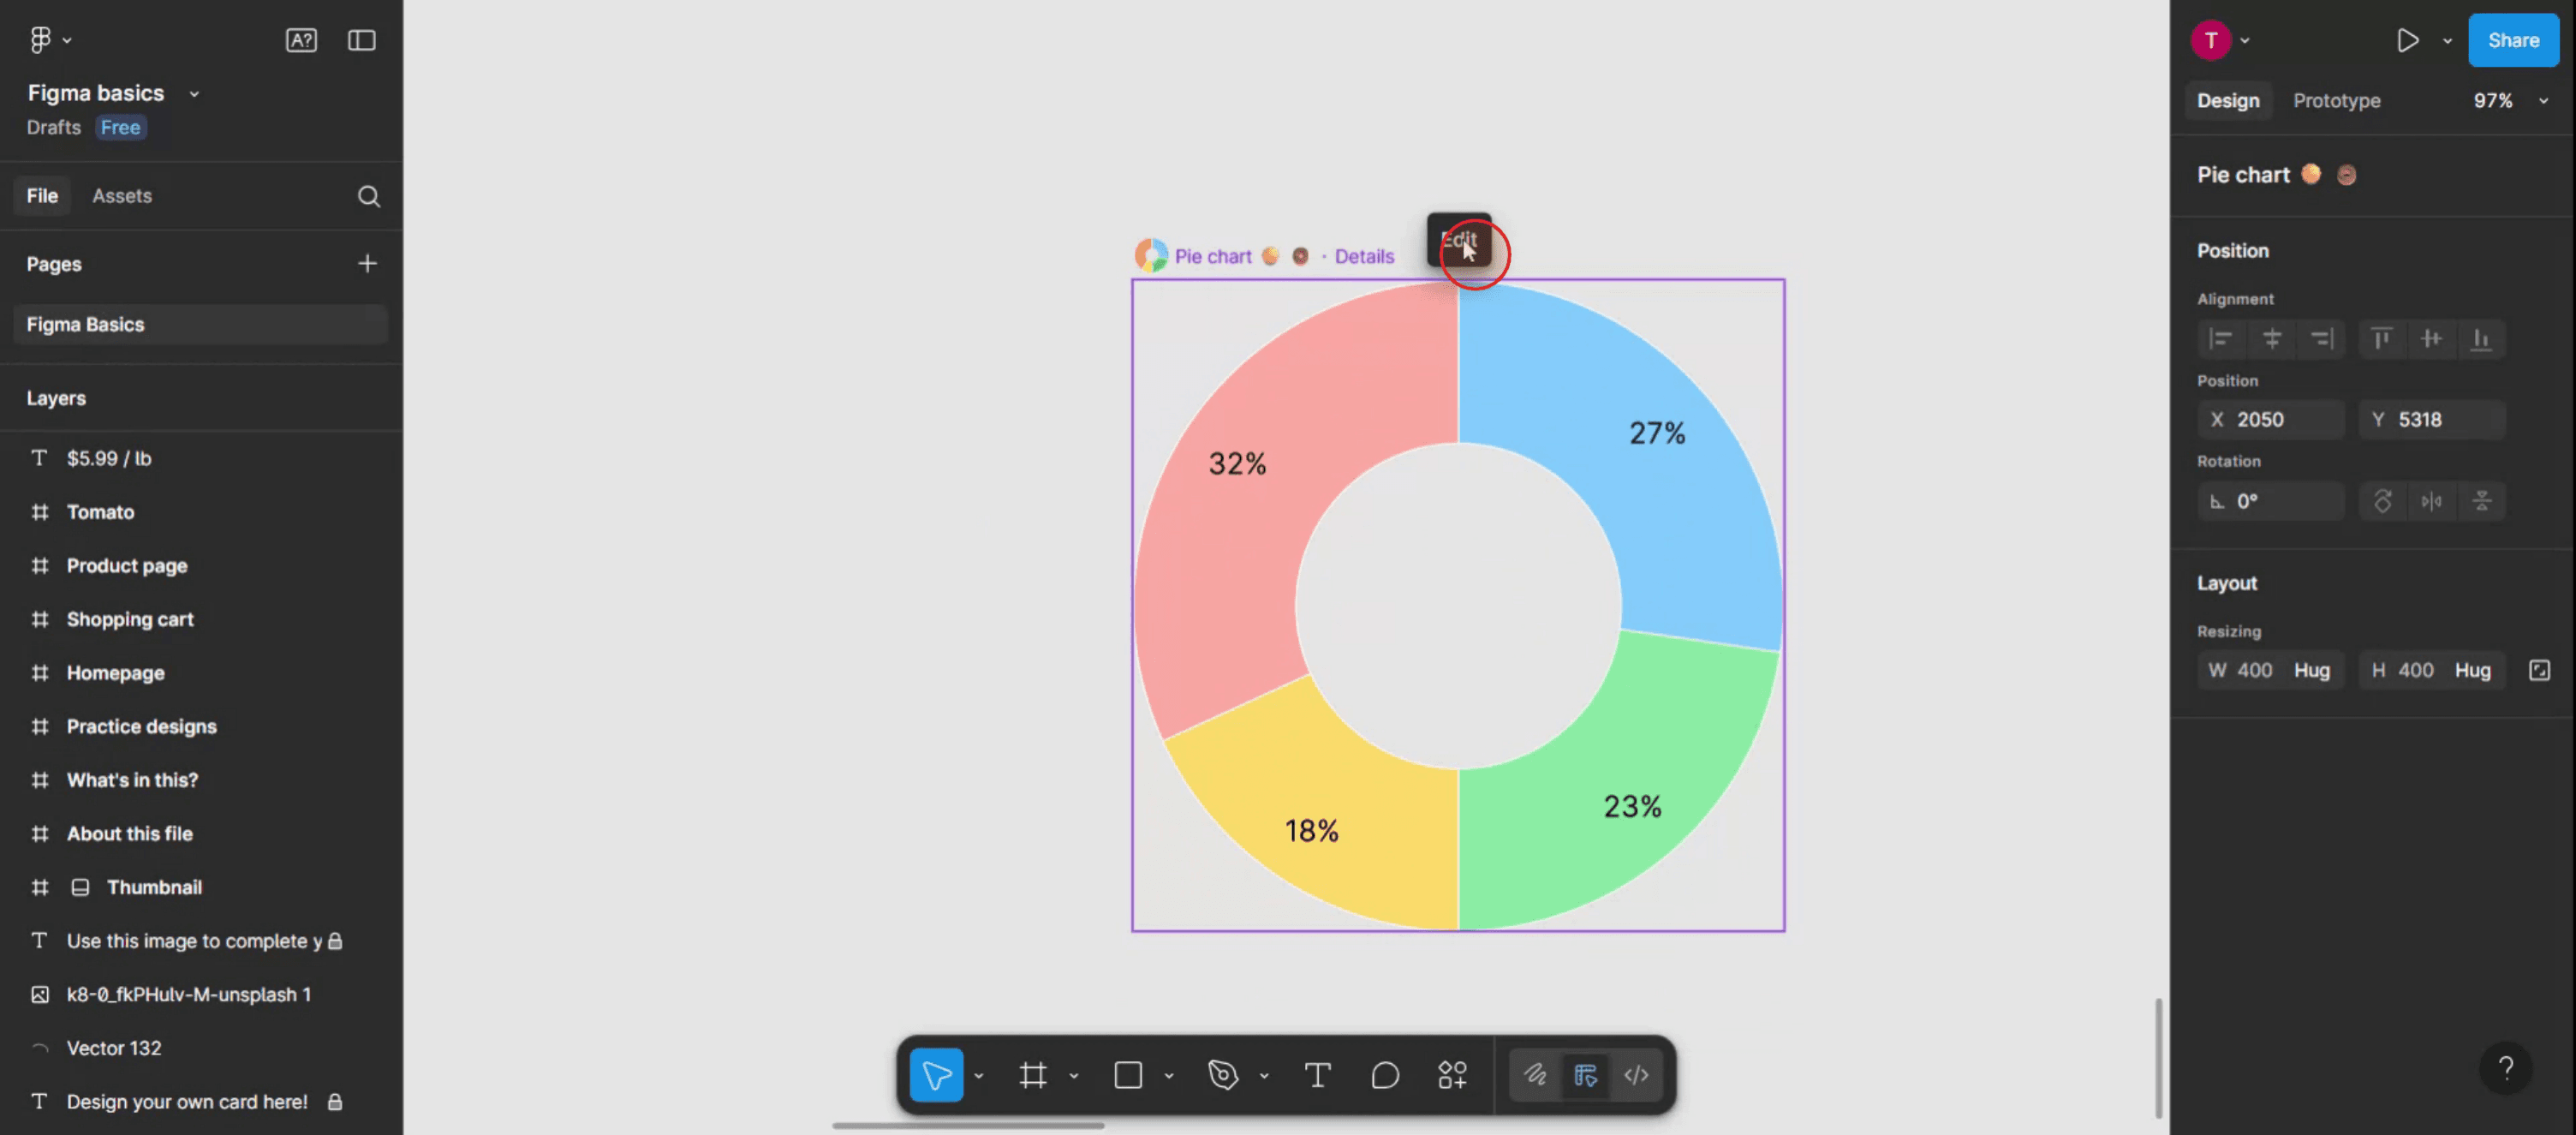
الخطوة 3
سيظهر المخطط الدائري الآن على شاشتك. بالإضافة إلى ذلك، ستلاحظ خيار "تعديل"؛ انقر عليه للمتابعة.
الخطوة 4
في هذه الخطوة، خصّص المخطط الدائري ليلائم احتياجاتك الخاصة. أدخل أي تسميات تريدها، وعند الانتهاء،
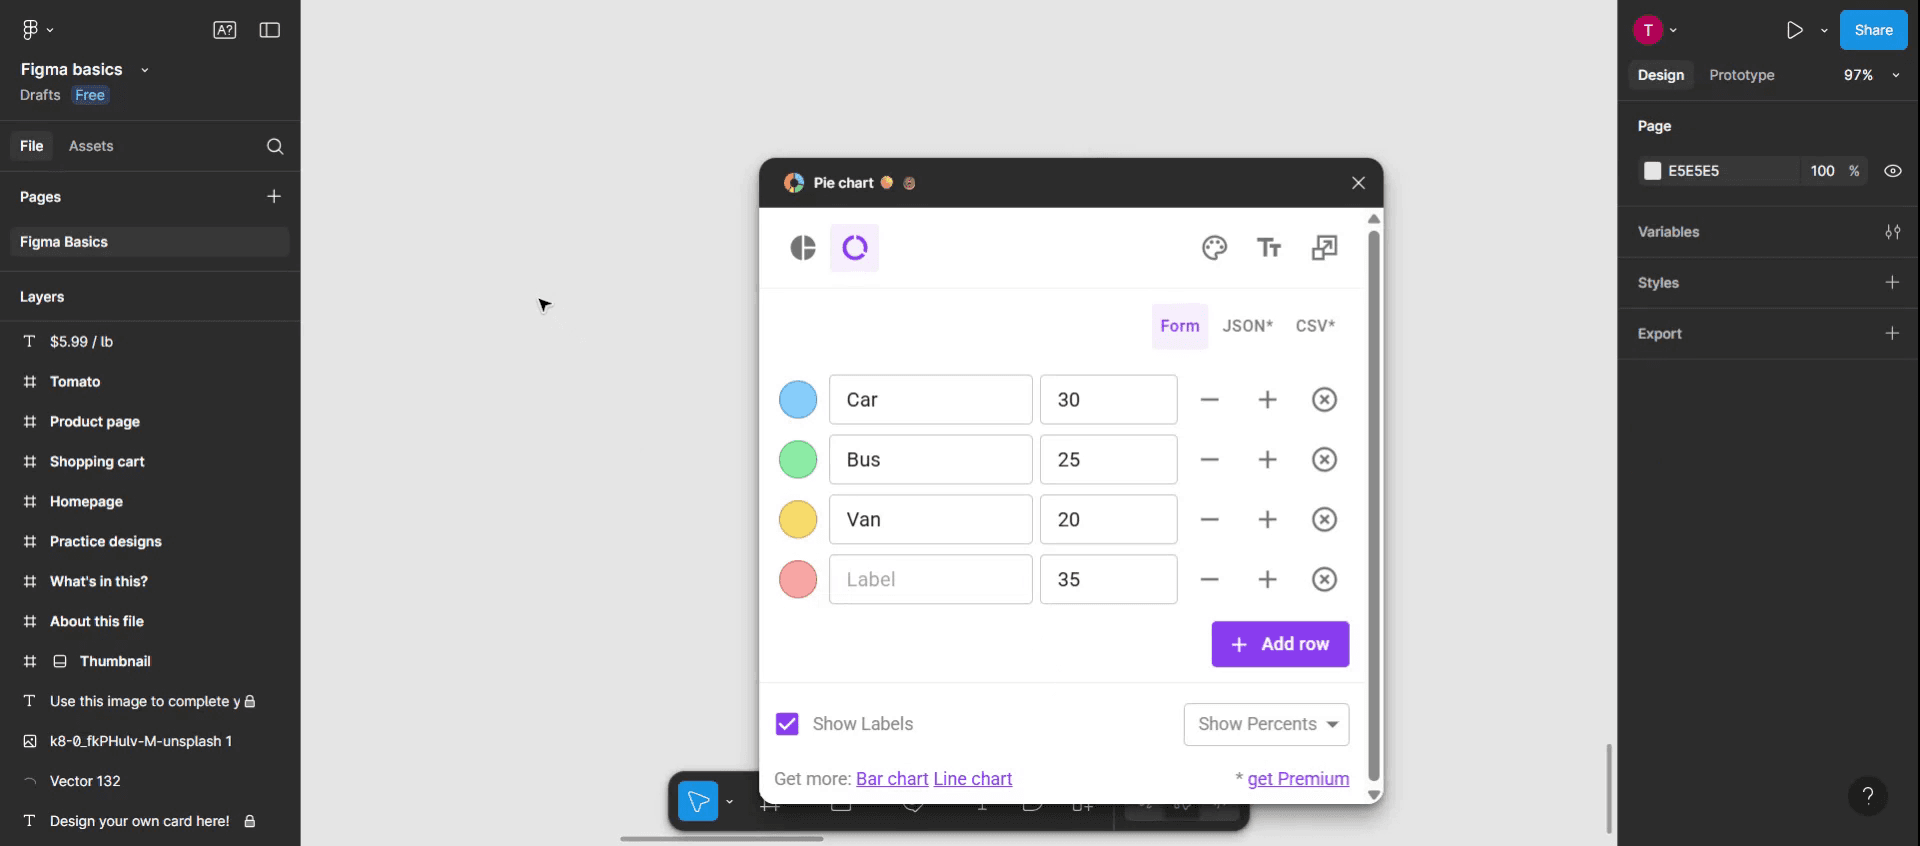
الخطوة 5
انقر في أي مكان على الشاشة للخروج من وضع التحرير.

الخطوة 6
سيتم تطبيق التغييرات التي أجريتها على المخطط الدائري.

نصائح احترافية لإنشاء مخطط دائري في فيغما
استخدم أداة الإهليلج لرسم الأساس
حدّد أداة الإهليلج (O)، ثم انقر واسحب على اللوحة مع الاستمرار في الضغط على Shift لرسم دائرة مثالية. ستكون هذه هي قاعدة المخطط الدائري الكاملة.حوّل الدائرة إلى قوس
بعد تحديد الدائرة، انتقل إلى لوحة الخصائص وعدّل إعدادات "Arc". فعّلها بتغيير زوايا "Start" و"End" لإنشاء تأثير شريحة.كرّر لإنشاء عدة أجزاء
لإنشاء المزيد من الشرائح، انسخ الدائرة (Ctrl/Cmd + D)، ثم عدّل زوايا القوس لكل جزء لتمثيل قيم البيانات المختلفة. استخدم ألوانًا مختلفة لكل شريحة.استخدم الرياضيات لتقسيم المخطط
إذا كانت بياناتك بالنسب المئوية، فاضرب 360 (درجة في الدائرة) في النسبة المئوية للحصول على زاوية كل شريحة. على سبيل المثال، 25% = 90°.استخدم ترميز الألوان للوضوح
استخدم أداة التعبئة لتعيين ألوان مميزة لكل شريحة. هذا يحسّن قابلية القراءة والمظهر البصري.
المشكلات الشائعة وكيفية تجنبها
الأقواس غير مصطفّة بشكل صحيح
تأكد من أن كل شريحة قوس تبدأ حيث تنتهي السابقة لتجنّب الفجوات أو التداخلات. أدخل زوايا البداية والنهاية يدويًا للحصول على دقة أعلى.فقدان تتبّع الزوايا
سمِّ الطبقات لديك بدرجات الشرائح أو تسميات البيانات حتى تعرف ما الذي يمثله كل جزء.تسميات النص غير مصطفّة
استخدم الأدلة الذكية أو قم بتوسيط النص يدويًا فوق كل شريحة للحفاظ على مظهر نظيف واحترافي.الشرائح تغطي بعضها البعض
انتبه إلى ترتيب الطبقات عند إضافة الشرائح. أرسل الشرائح إلى الأمام أو الخلف حسب الحاجة لتجنّب إخفاء الأجزاء الأخرى.النسب غير الدقيقة
تحقق من حساباتك جيدًا عند تحويل النسب المئوية إلى زوايا لضمان تمثيل دقيق للبيانات.
الأسئلة الشائعة حول المخططات الدائرية في فيغما
هل يمكنني إنشاء مخطط دائري في فيغما بدون إضافات؟
نعم، يمكنك استخدام أداة القطع الناقص وإعدادات القوس لإنشاء مخططات دائرية يدويًا دون أي إضافات.هل توجد إضافة لإنشاء المخططات الدائرية في فيغما؟
نعم، تتوفر إضافات مثل "Chart" أو "Pie Chart Maker" لأتمتة العملية باستخدام مدخلات البيانات.كيف أنشئ شريحة دقيقة بنسبة 25٪؟
اضرب 360 في 0.25 (25٪)، فيعطيك ذلك 90 درجة. اضبط زاوية القوس لتغطي 90° للحصول على شريحة مثالية بنسبة 25٪.هل يمكنني تحريك المخططات الدائرية في فيغما؟
على الرغم من أن فيغما تدعم رسومًا متحركة بسيطة للنماذج الأولية، فإن الرسوم المتحركة المعقدة المعتمدة على البيانات يجب إنشاؤها خارج فيغما.هل يمكنني تصدير المخططات الدائرية من فيغما؟
نعم، حدّد المخطط الدائري، ثم انتقل إلى لوحة التصدير، واختر التنسيق المفضّل لديك (PNG، SVG، PDF)، ثم انقر على تصدير.كيف أسجل الشاشة على mac؟
لتسجيل الشاشة على جهاز Mac، يمكنك استخدام Trupeer AI. يتيح لك التقاط الشاشة بالكامل ويوفر إمكانات الذكاء الاصطناعي مثل إضافة صور رمزية للذكاء الاصطناعي، وإضافة تعليق صوتي، وإضافة التكبير والتصغير في الفيديو. ومع ميزة ترجمة الفيديو بالذكاء الاصطناعي من trupeer، يمكنك ترجمة الفيديو إلى أكثر من 30 لغة.كيف أضيف صورة رمزية بالذكاء الاصطناعي إلى تسجيل الشاشة؟
لإضافة صورة رمزية بالذكاء الاصطناعي إلى تسجيل شاشة، ستحتاج إلى استخدام أداة تسجيل شاشة بالذكاء الاصطناعي. Trupeer AI هي أداة لتسجيل الشاشة بالذكاء الاصطناعي، تساعدك على إنشاء مقاطع فيديو باستخدام عدة صور رمزية، كما تساعدك أيضًا على إنشاء صورتك الرمزية الخاصة للفيديو.كيف أسجل الشاشة على windows؟
لتسجيل الشاشة على Windows، يمكنك استخدام Game Bar المدمجة (Windows + G) أو أداة ذكاء اصطناعي متقدمة مثل Trupeer AI للحصول على ميزات أكثر تقدمًا مثل الصور الرمزية بالذكاء الاصطناعي، والتعليق الصوتي، والترجمة، إلخ.كيف أضيف تعليقًا صوتيًا إلى الفيديو؟
لإضافة تعليق صوتي إلى مقاطع الفيديو، نزّل إضافة Trupeer AI لمتصفح Chrome. بعد التسجيل، ارفع فيديوك مع الصوت، واختر التعليق الصوتي المطلوب من Trupeer ثم صدّر الفيديو المعدّل.كيف أقوم بالتكبير في تسجيل الشاشة؟
لاستخدام التكبير أثناء تسجيل الشاشة، استخدم تأثيرات التكبير في Trupeer AI التي تتيح لك التكبير والتصغير في لحظات محددة، مما يعزز التأثير البصري لمحتوى الفيديو الخاص بك.
قراءات مقترحة
دروس ذات صلة

