

Criar um gráfico de velocidade no Jira
Aprende a criar um gráfico de velocidade no Jira para acompanhar o desempenho da equipa ao longo das sprints. Guia passo a passo para visualizar os pontos de história concluídos e melhorar o planeamento das sprints.
Para criar um Gráfico de Velocidade no Jira, precisa de navegar para um projeto Scrum e, em seguida, aceder à secção Relatórios, onde pode encontrar e selecionar o Gráfico de Velocidade. O gráfico visualiza o progresso da equipa ao mostrar o trabalho total estimado comprometido para cada sprint versus o trabalho concluído. Isto ajuda no planeamento de sprints e na compreensão da capacidade da equipa.
Segue uma análise mais detalhada:
1. Aceder ao Gráfico de Velocidade:
Vá para o projeto Scrum relevante no Jira.
Clique em "Reports" na barra lateral esquerda.
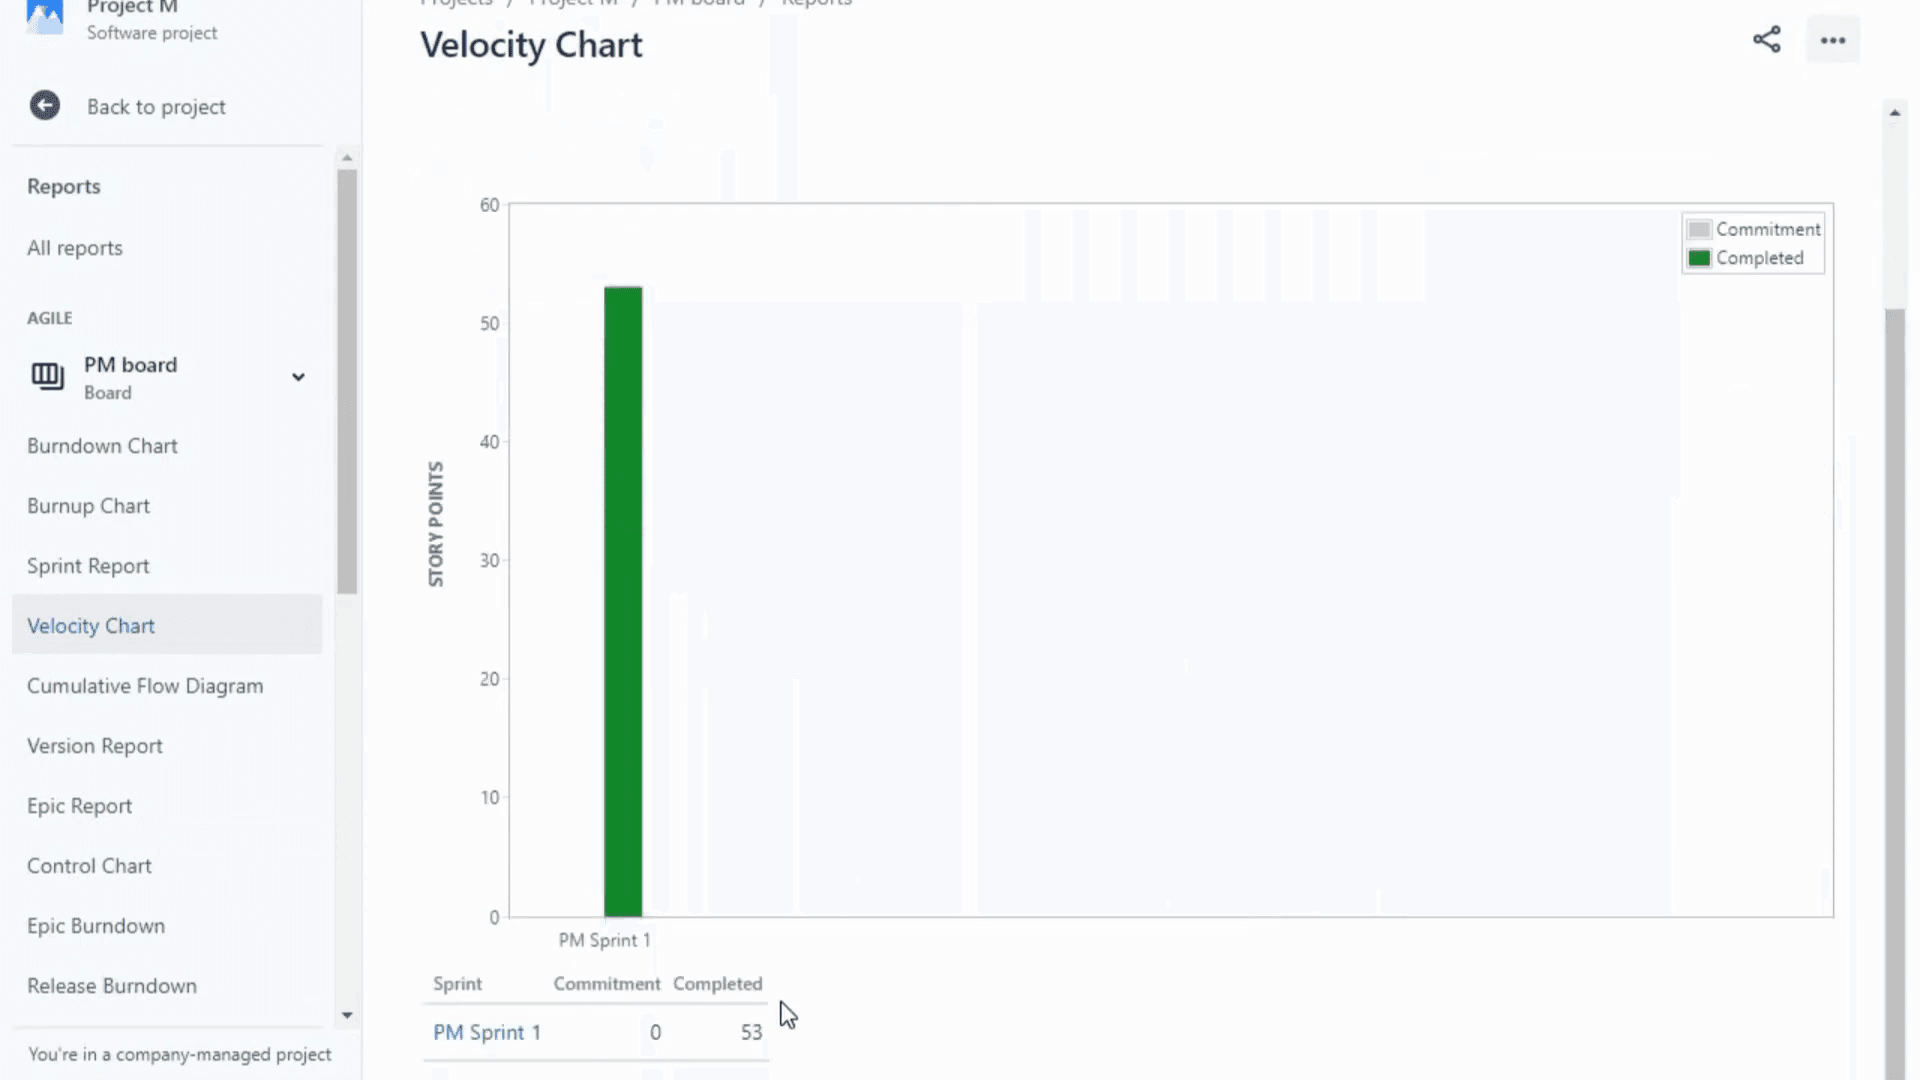
Escolha "Velocity Chart" na lista de relatórios disponíveis.
2. Compreender o Gráfico:
O eixo Y representa a estimativa escolhida (por exemplo, story points, número de issues, etc.).
A barra cinzenta mostra o trabalho total estimado para cada sprint.
A barra verde mostra o trabalho concluído para cada sprint.
3. Utilizar o Gráfico de Velocidade:
Planeamento de Sprint: Ao observar o trabalho concluído em sprints anteriores, pode estimar melhor quanto trabalho a equipa consegue assumir no próximo sprint.
Acompanhamento do Progresso: O gráfico acompanha visualmente o progresso da equipa ao longo do sprint, destacando potenciais compromissos excessivos ou insuficientes.
Dados Históricos: O Jira normalmente guarda os últimos 7 sprints, fornecendo contexto histórico para as tendências de velocidade.
Identificação de Problemas: Se houver uma discrepância significativa entre o trabalho comprometido e o concluído, isso pode indicar potenciais problemas como compromisso excessivo, alargamento do âmbito ou problemas com a estimativa.
Guia passo a passo: Criar um Gráfico de Velocidade no Jira
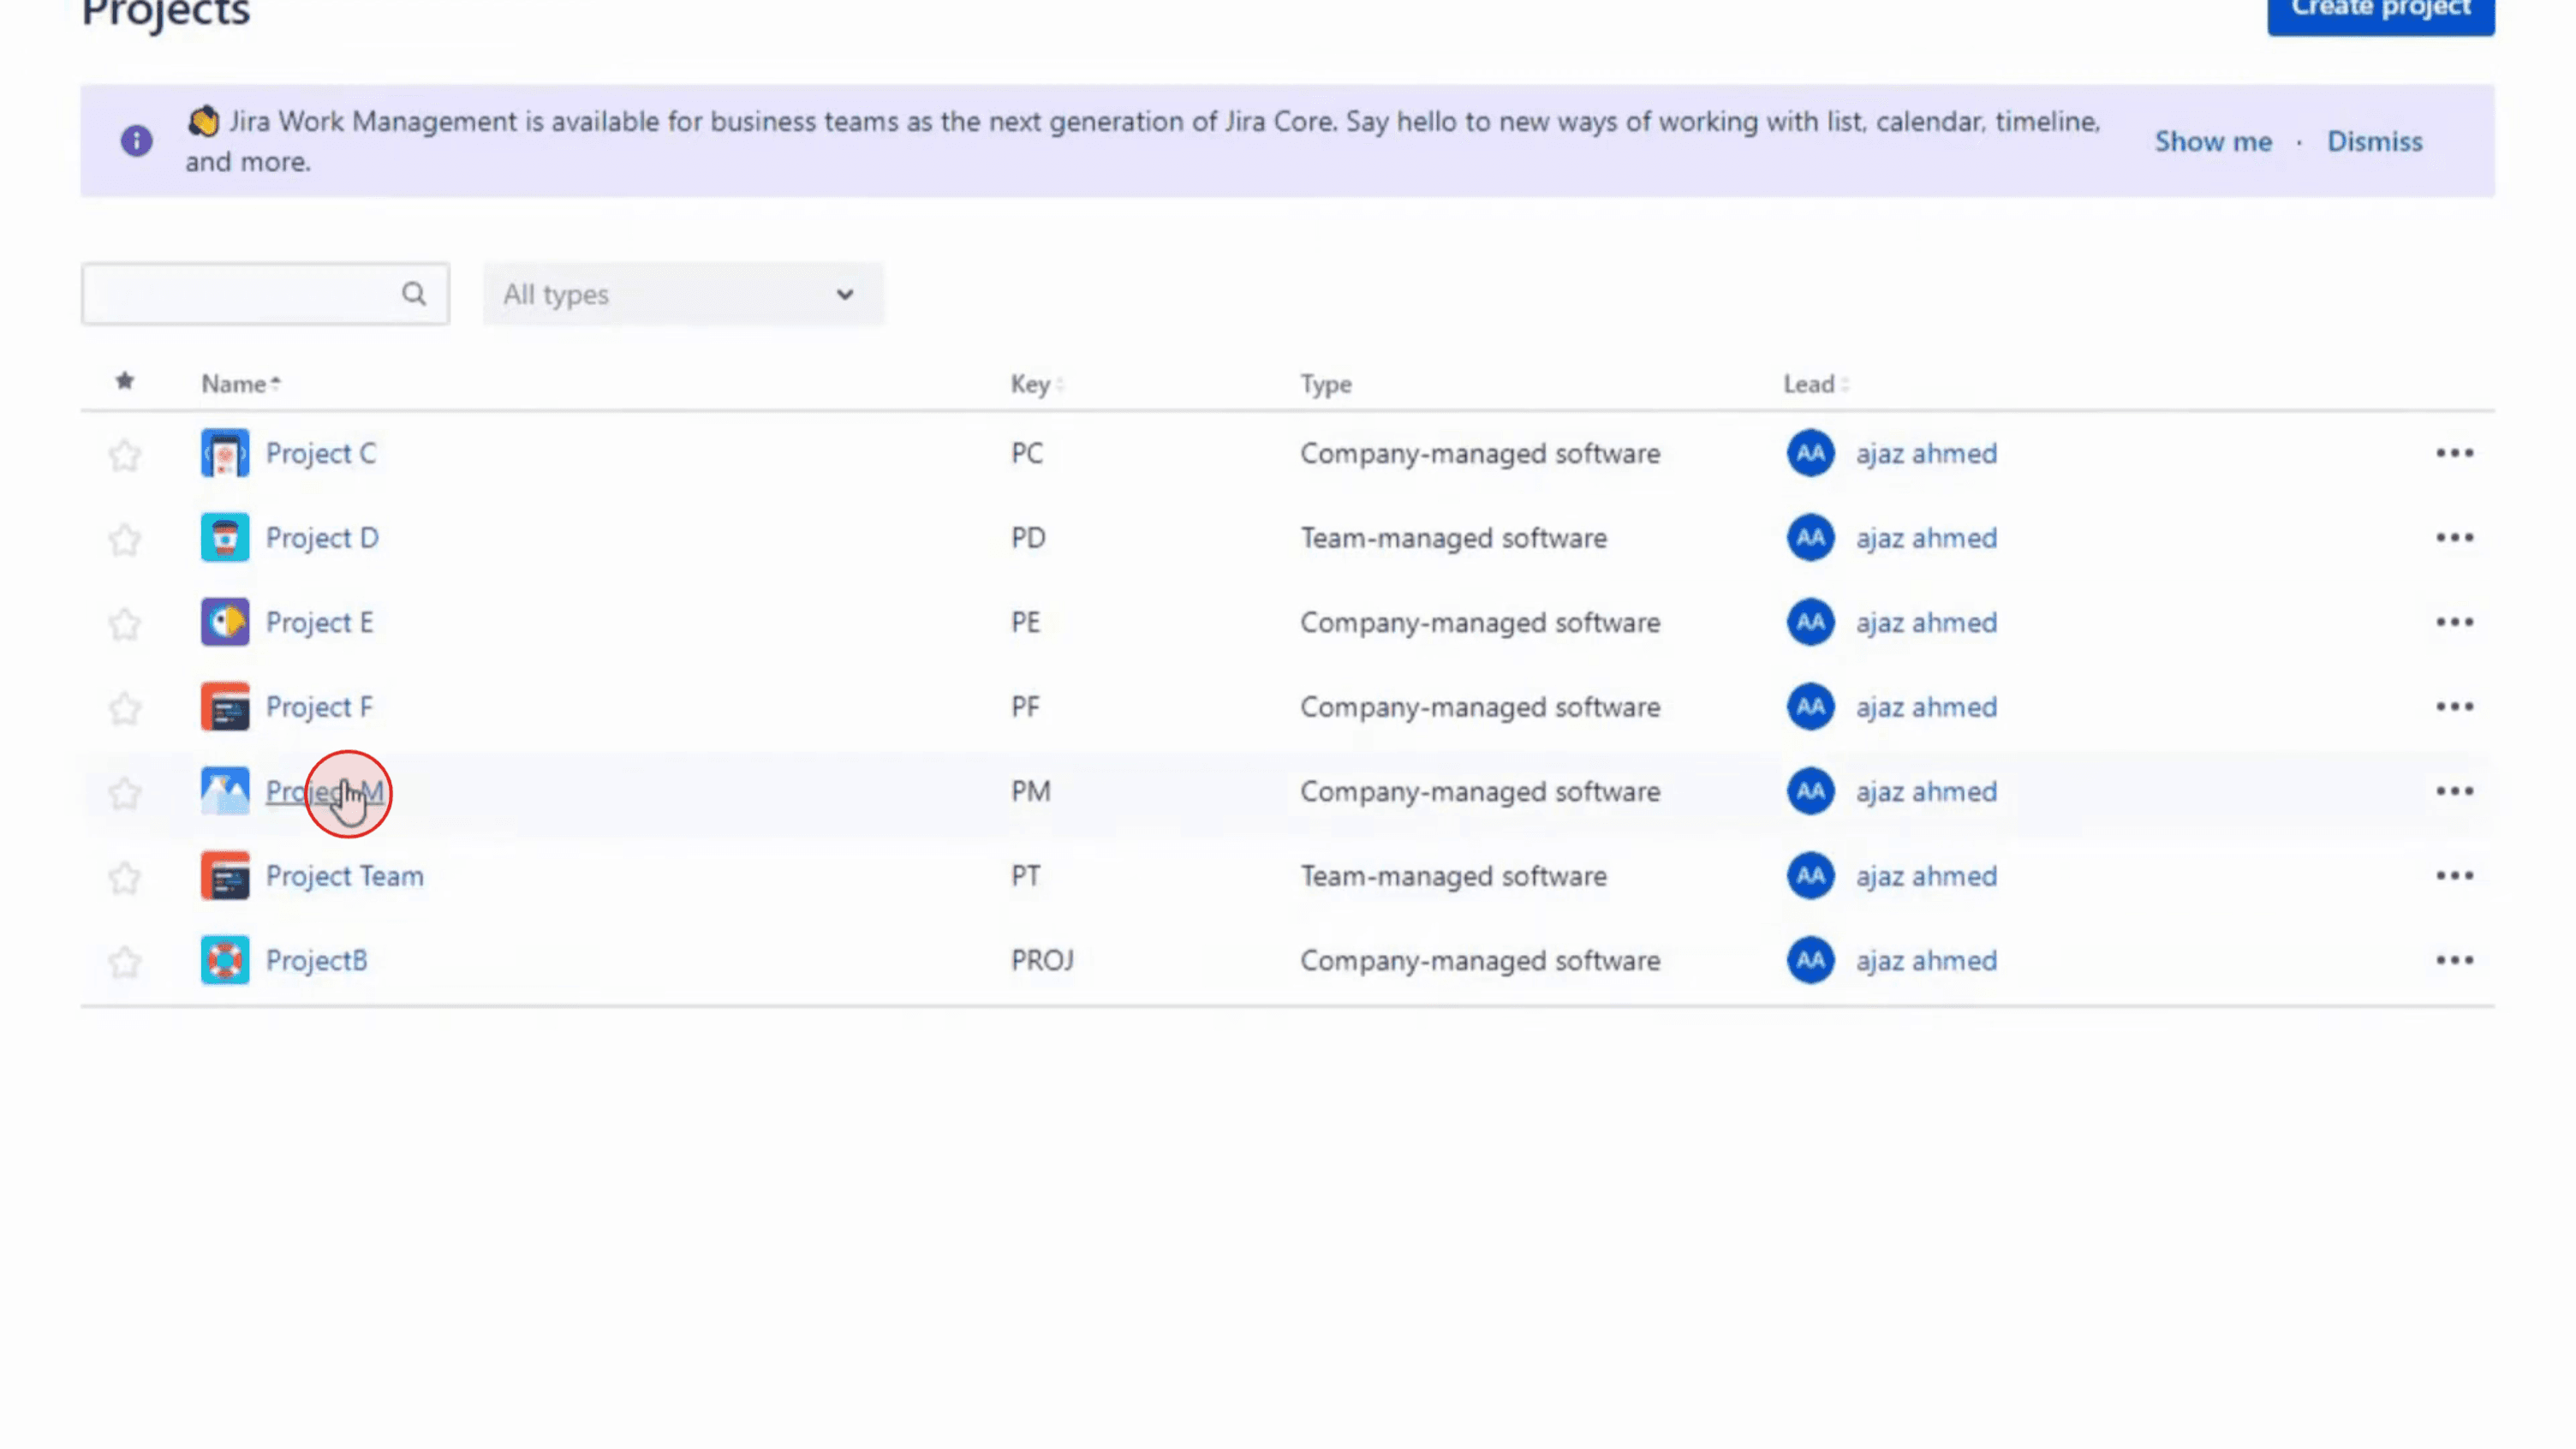
Passo 1
Vá para o projeto para o qual quer criar o gráfico de velocidade.
Passo 2
Clique em 'Reports' na barra lateral esquerda ou no menu do projeto
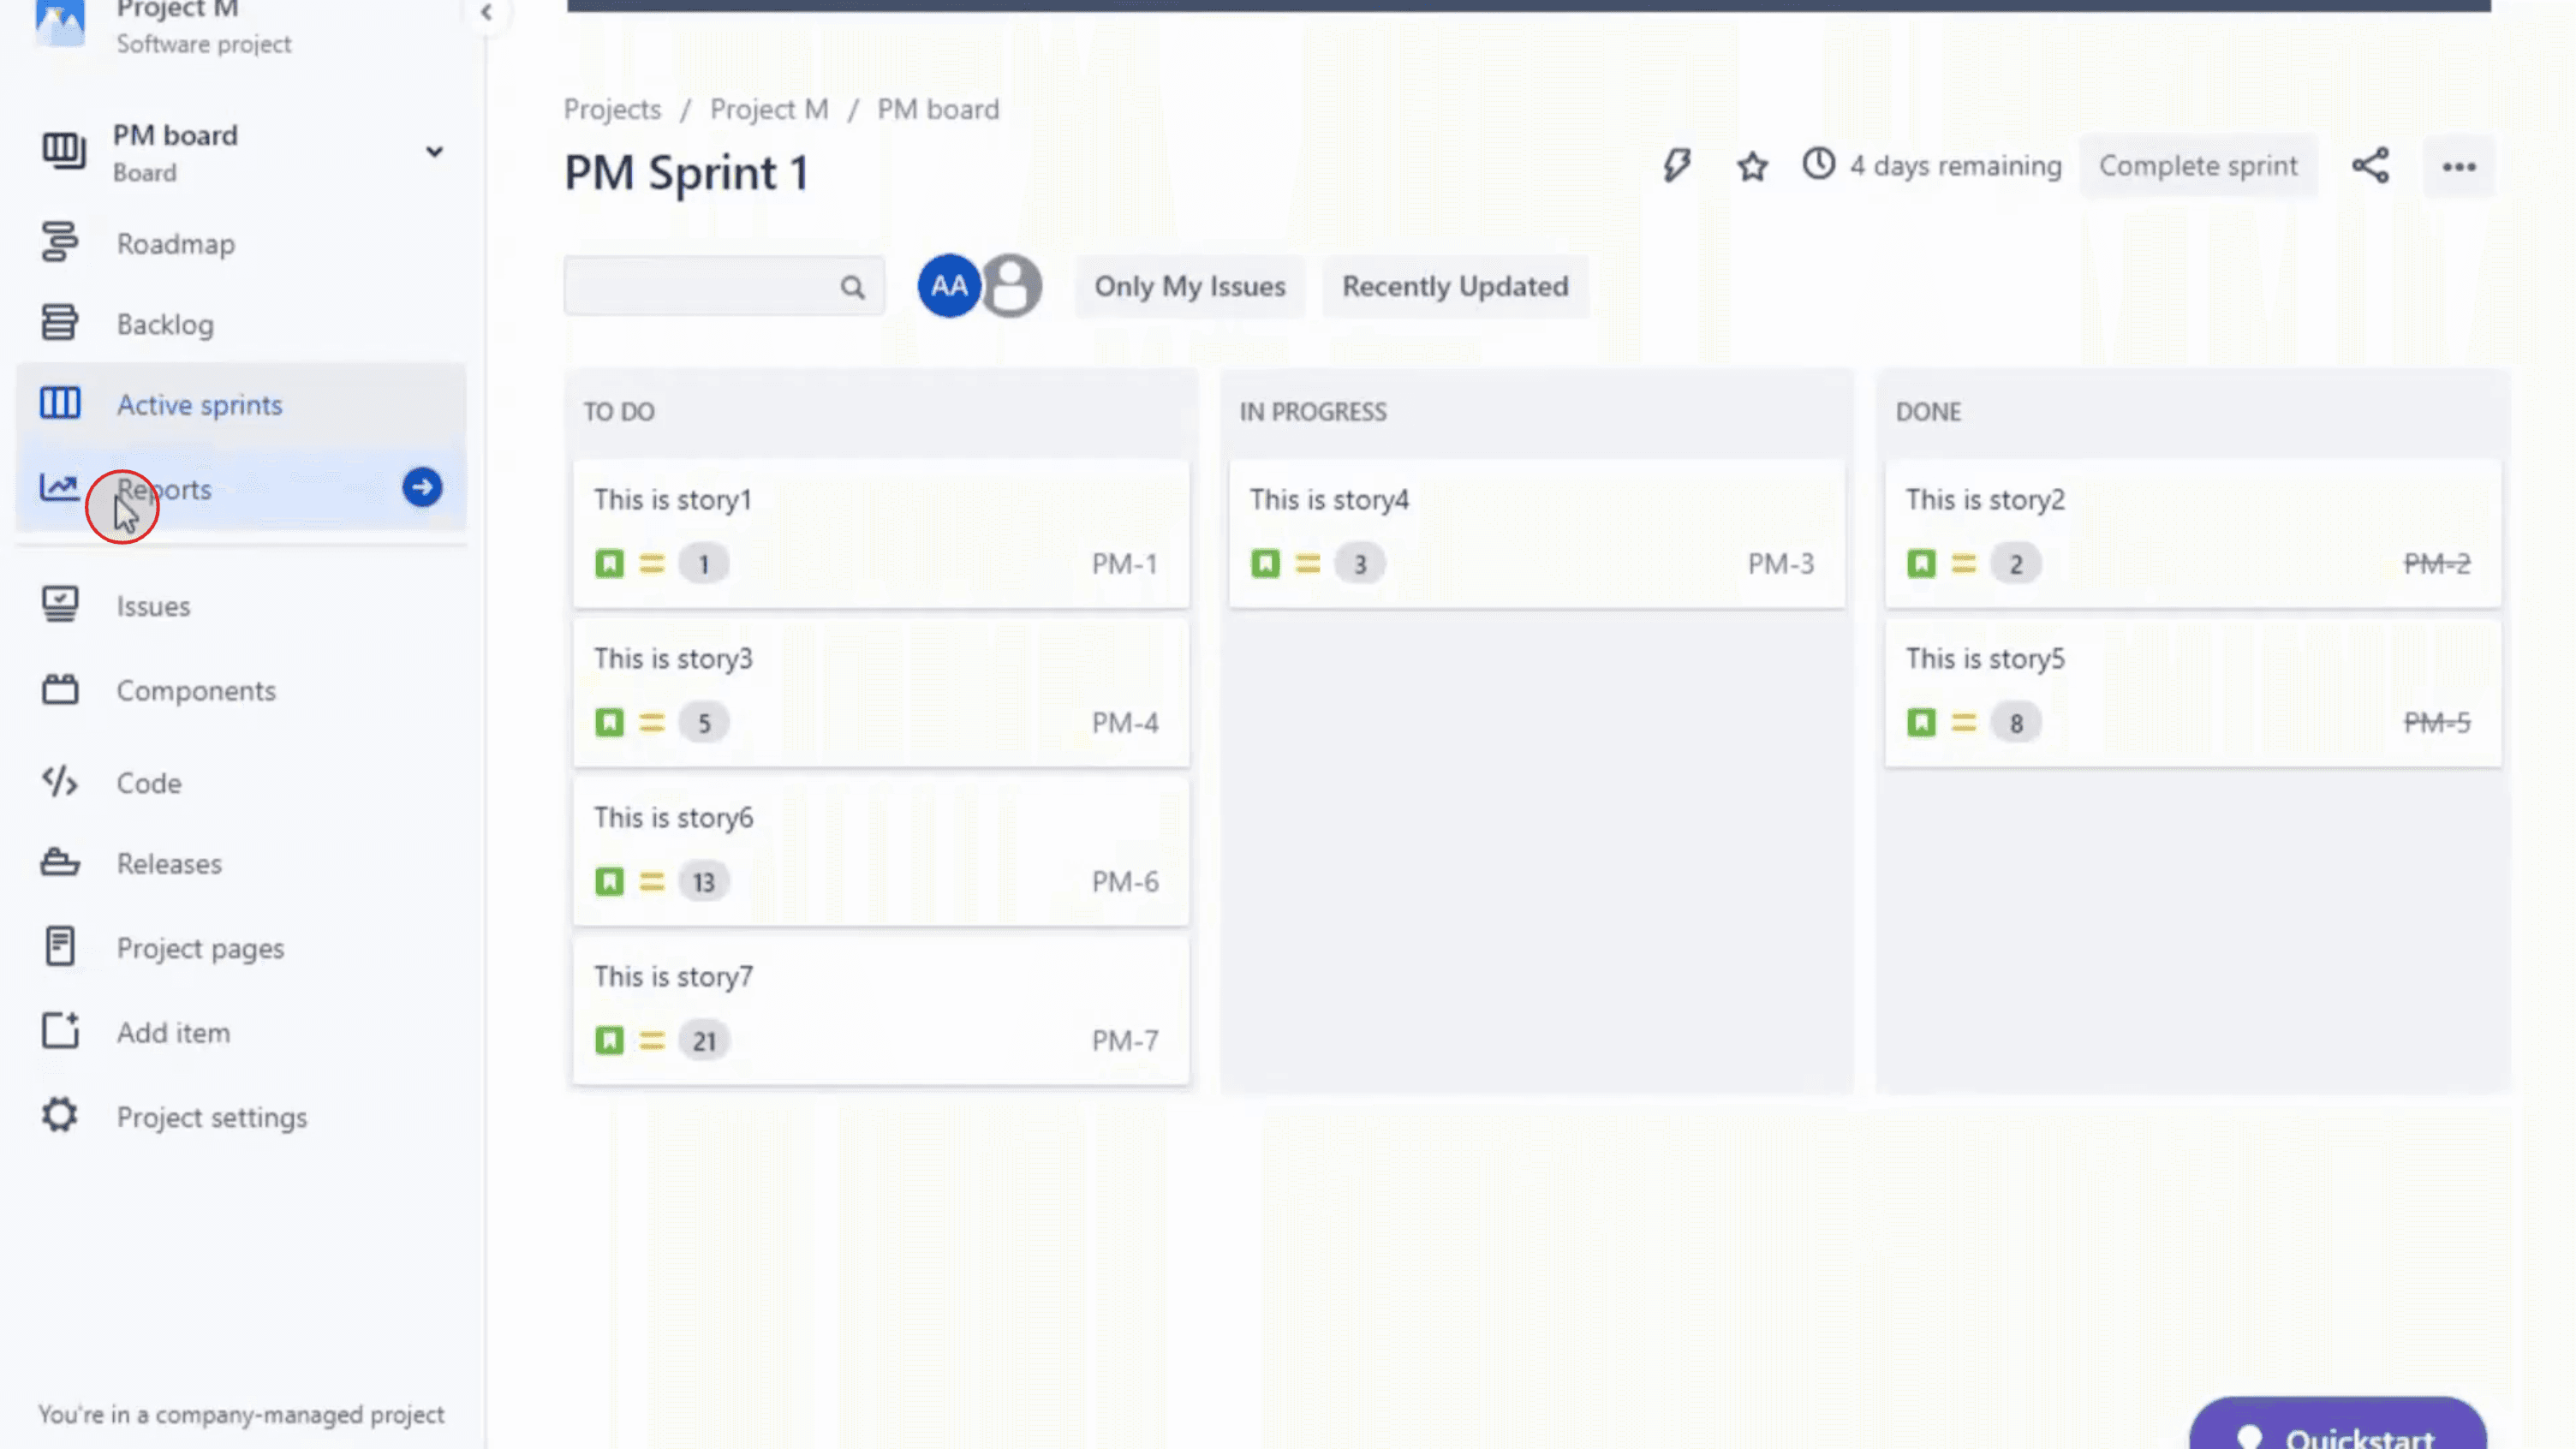
Passo 3
Na secção Relatórios, encontre e selecione 'Velocity Chart' na lista de relatórios disponíveis.

Passo 4
Ao seguir estes passos, pode criar e utilizar eficazmente um gráfico de velocidade no Jira para acompanhar e gerir o desempenho da sua equipa ao longo do tempo.
Dicas profissionais para criar um gráfico de velocidade no Jira
Inicie sessão na sua conta Jira
Aceda ao seu espaço de trabalho Jira e inicie sessão com as credenciais da sua conta.Selecione o quadro Scrum relevante
No painel do seu projeto, escolha o quadro Scrum associado ao projeto para o qual pretende ver o gráfico de velocidade.Clique em Relatórios na barra lateral esquerda
No menu lateral do seu quadro Scrum, clique em Relatórios para ver vários relatórios Agile disponíveis no Jira.Escolha a opção Gráfico de velocidade
Da lista de relatórios disponíveis, selecione Gráfico de velocidade. Será aberto um gráfico que mostra o trabalho concluído e comprometido ao longo dos sprints anteriores.Compreenda os dados apresentados
O gráfico mostra a quantidade de story points (ou outras unidades de estimativa) comprometida no início de cada sprint e a quantidade efetivamente concluída no final.Use a lista pendente para selecionar um intervalo temporal
Se quiser focar-se em sprints específicos, use o menu pendente ou os filtros para escolher quantos sprints recentes incluir no gráfico.Analise a velocidade da equipa
Use o gráfico para comparar o trabalho estimado com o trabalho concluído pela equipa. Isto ajuda a prever quanto trabalho a sua equipa consegue assumir nos próximos sprints.
Erros comuns e como evitá-los
Usar um quadro Kanban em vez de Scrum
Os gráficos de velocidade só estão disponíveis em quadros Scrum. Se o seu projeto estiver a usar Kanban, este relatório não estará disponível.Sem valores de estimativa definidos
O gráfico de velocidade requer que sejam adicionados story points ou outra unidade de estimativa aos itens do backlog. Sem estimativa, o gráfico aparecerá em branco.Configuração de sprint incompleta
Certifique-se de que os sprints são iniciados e concluídos corretamente no quadro; caso contrário, o gráfico não apresentará dados úteis.Ver poucos sprints
Se a sua equipa tiver concluído apenas um ou dois sprints, o gráfico de velocidade não mostrará tendências. Aguarde até que alguns sprints estejam concluídos para obter melhores informações.Interpretar mal o gráfico
Lembre-se de que a velocidade é uma referência, não um valor fixo. Use as tendências para planear a capacidade, e não para garantir a entrega.
Perguntas frequentes comuns sobre gráficos de velocidade no Jira
O que é um gráfico de velocidade no Jira?
É um gráfico que mostra quanto trabalho uma equipa se compromete a fazer em comparação com quanto conclui em cada sprint, ajudando a prever o desempenho futuro.Posso usar um gráfico de velocidade com quadros Kanban?
Não, os gráficos de velocidade só são suportados em quadros Scrum no Jira.Como são calculados os pontos de história no gráfico de velocidade?
O Jira totaliza os pontos de história dos itens comprometidos no início e dos concluídos até ao fim de cada sprint.Porque é que o meu gráfico de velocidade está em branco?
Pode não ter adicionado valores de estimativa ou os seus sprints não estão corretamente configurados ou concluídos.Posso personalizar o gráfico de velocidade?
O gráfico integrado não é muito personalizável, mas pode usar aplicações de terceiros do Atlassian Marketplace para relatórios avançados.Como gravar ecrã num Mac?
Para gravar ecrã num Mac, pode usar o Trupeer AI. Permite-lhe capturar o ecrã inteiro e oferece capacidades de IA, como adicionar avatares de IA, adicionar locução e fazer zoom in e zoom out no vídeo. Com a funcionalidade de tradução de vídeos com IA da Trupeer, pode traduzir o vídeo para mais de 30 idiomas.Como adicionar um avatar de IA a uma gravação de ecrã?
Para adicionar um avatar de IA a uma gravação de ecrã, terá de usar uma ferramenta de gravação de ecrã com IA. O Trupeer AI é uma ferramenta de gravação de ecrã com IA, que o ajuda a criar vídeos com vários avatares e também o ajuda a criar o seu próprio avatar para o vídeo.Como gravar ecrã no Windows?
Para gravar ecrã no Windows, pode usar a Barra de Jogo integrada (Windows + G) ou uma ferramenta avançada de IA como o Trupeer AI para funcionalidades mais avançadas, como avatares de IA, locução, tradução, etc.Como adicionar locução a um vídeo?
Para adicionar locução a vídeos, descarregue a extensão do Chrome do trupeer ai. Depois de se registar, carregue o seu vídeo com voz, escolha a locução pretendida do Trupeer e exporte o seu vídeo editado.Como faço zoom numa gravação de ecrã?
Para fazer zoom durante uma gravação de ecrã, use os efeitos de zoom no Trupeer AI, que permitem aproximar e afastar em momentos específicos, melhorando o impacto visual do conteúdo do seu vídeo.
As pessoas também perguntam
Gerador de documentação técnica
Software de base de conhecimentos
Como exportar o backlog do Jira para Excel
Como alterar o tipo de issue no Jira
Tutoriais relacionados

